TECHNICAL REPORT
| Grantee |
Raihana Syahirah Abdullah
|
| Project Title | A novel graph analytics theory model to mitigate IoT botnets attacks for big data |
| Amount Awarded | 13000 USD |
| Dates covered by this report: | 2018-10-17 to 2019-10-17 |
| Report submission date | 2019-10-15 |
| Economies where project was implemented | Malaysia |
| Project leader name |
Raihana Syahirah Abdullah
|
| Project Team |
Raihana Syahirah Abdullah
[email protected]
|
Project Summary
The Internet of Things (IoT) is emerging in full force and anyone could be trouble if they are not prepared to protect their networks. Everything is become internet-enables. The internet-connected with the smart devices and machines can create vulnerabilities within organization. Many IoT devices that are currently in use have lax or no security capabilities making it is easy to compromise and easy target for hackers to breach the critical information. As technology evolved, hackers building more sophisticated IoT botnets to do illicit purposes in IoT devices. Todays, hackers targeting organizations across all sectors but healthcare sectors have more at stake because their services are so central to people’s lives. In order the reliance on so many IoT devices, hacker exploit IoT devices to create powerful botnets attack and make difficulties to organizations defend against menaces. Yet, none of previous research use graph analytics theory model to mitigate the IoT botnets in organizations. Therefore, this research attempts to get the parameter from raw infection codes using a reverse engineering approach as well as addressing the real behaviours of IoT botnets. The main objective of the research is to develop a new model in detecting IoT botnets using graph analytics theory model with analysing the selection of influence feature factor. Two main steps are needed in this research. Firstly is to analyse the behaviour of IoT botnets using reverse engineering approach by distinguish the IoT botnets activities from raw infection codes. Secondly is to develop the new graph analytics theory model for detecting IoT botnets attack. The expected output of this research is a scheme that is able to remove and quarantine the suspicious codes as well as able to detect the behaviour changes in the IoT devices due to influence feature factor that is embedded inside the approach. The model also can be used for security tool community who want to get and discover the real behaviors of IoT botnets from the raw infection codes that exists in particular IoT devices and machines.
Table of contents
- Project factsheet information
- Background and justification
- Project Implementation
- Project Evaluation
- Gender Equality and Inclusion
- Project Communication Strategy
- Recommendations and Use of Findings
- Bibliography
Background and Justification
The trending of Internet of Things (IoT) has become popularized by the industries as emerging technology that will continue to growth throughout the years. However, the technologies which dependent on continuous online environment will likely to become target for attackers. With current threat such as ransomware, botnet and other malware rampaging in our network, IoT will become difficult to approach for companies who tries to embrace it. IoT botnets has become a serious threat especially in healthcare organization that utilize IoT devices for their working environment thus, this project will be focusing on IoT botnet whether it’s behavior or attack pattern. Previous researcher tends to provide solution such as detection based on specific behavior but there is no research mentioning graph analytics theory model to mitigate IoT botnet attacks.
Currently, worldwide is trending with the year of the Internet of Things (IoT) and the latest analyst forecasts indicate that growth will continue to accelerate through the year. But, in this highly connected environment, new security threats and creative forms of cyber attack are emerging to exploit any weak links. IoT botnets and ransomware are already making the headlines. The Internet of Things (IoT) promises many benefits for both consumers and business. But, without strong security, attacks similar to those that affected more than 100,000 devices could become an everyday occurrence. Mitigating the IoT botnet attacks is a particularly challenging task. Internet of things (IoT) devices, refers to inter-networking devices, which can communicate through network enabled. In IoT area, more researchers focus on the development of IoT smart devices from secure the IoT devices vulnerabilities. However, IoT devices are still in its infancy and insecure devices have continued to be a problem over the last couple of years (Victoria, 2017). Hackers are increasingly taking advantage of these vulnerabilities to add insecure IoT devices to already well functioning IoT botnets (Nickilaos, 2017). These pools of vulnerable devices have added to the capabilities of IoT botnets which have lead to stronger attacks. In addition, the large number of insecure Internet of Things (IoT) devices with high computation power make them an easy and attractive target for attackers seeking to compromise these devices and use them to create large-scale botnets (Nasser et. al., 2017). Consequently, many IoT devices lack even elementary security such as IoT devices do not have well security perimeters and continuously change due to device and user mobility (Nayeem, 2017).
Furthermore, selecting a significant influence feature also important in IoT botnet detection because it depends on feature that involved (Eslahi et al., 2015). Based on statement Technology (2008), existing research focusses more on the technique of recognition rather than uncovering the purpose behind the influence feature. Moreover, most of researcher only used the feature inside the system without mentioning the influence feature in IoT botnet detection. Thus, it is necessary to reveal influence feature in IoT botnet detection using any machine learning approach. As technology evolved, hackers building more sophisticated IoT botnets to do illicit purposes in IoT devices to launch massive attacks. Todays, hackers are indiscriminate, they are targeting organizations across all sectors but healthcare sectors have more at stake because their services are so central to people’s lives. In healthcare sector, while IoT data from smart things and sensors capturing health related data can be collected and processed with the intent of improving our daily lives, communications among smart devices could also reveal private information about patients. According to Aysha (2017), the risks in IoT-based critical systems is becoming more significant, and any interruption or corruption could result in costly damage as life threatening challenges. From the previous, there are many techniques that used for protecting patient information in medical but none yet focus in the impact of IoT botnets behaviour changes at the IoMT (Internet of Medical things) devices level. This research direction is emphasizing to get the influence feature of IoMT healthcare devices and reveal the IoT botnets behaviour changes by producing one of the security optimization approach which is graph analytics theory model to detect the present of IoT botnets attacks. Significantly, the process of finding, identifying, classifying and detecting the IoT botnets will collaborate with Cyber Security Malaysia since the latest IoT botnets is distribute by them.
Botnets, also known as zombie armies, are posing a huge threat to IoT security (Aviv and Haeberlen, 2011). An IoT botnet (Internet of Things botnet) is a group of hacked computers, smart appliances and Internet-connected devices that have been co-opted for illicit purposes (Nickilaos, 2017). They are capable of attacking critical infrastructure and distributing malware through weak links in the chain. In a connected environment, this can result in further infected devices within the network. And, most of the time, this happens without the knowledge of the device owner. Connected medical devices are just one of the IoT categories that have proved to be vulnerable to hackers. It will take considerable work to secure these connected devices. But, until then, there are genuine concerns over the security of medical information and a significant risk compromising patient confidentiality. Botnets have the opportunity to thrive in the IoT environment because many of these connected devices do not have malware protection. Symantec claiming that the IoT devices, including the refrigerator and smart tv, were the source of the massive spam attack (Symantec, 2015). In their view, that specific spam attack was generated by a typical IoT botnets based on an infected IoT smart devices. With the proliferation of Internet applications and services, cyber criminals discovered a treasure-trove to explore and exploit by using IoT botnets and ransomware. Now, with the rise of the IoT, a new generation of malware is emerging.
This research will be discussed based on the taxonomy of the project background as displayed in Figure 1.1. There are many kinds of IoT botnet such as Torii, BASHLITE, Mirai, Aidra and Hajime. IoT botnet attacks give massive impact as it cause big total lost all over the world. Moreover, based on the listed IoT botnet types, Mirai is the famous IoT botnet that attacks the users since the first attack in 2016 (Antonakakis et al., 2017). Mostly, malware activities exist in windows registry and Dynamic-link library (DLLs). Thus, the effects of the malware attacks, it is needed to consult an approach to detect a malware pattern based on their behavior in the attacked location such as windows registry, file system, and DLL. There are a several kinds of detection which are firewall, honeypot, intrusion detection system (IDS), and sandbox. This study will focus on sandbox detection analysis as detection method to detect malware in windows registry, DLLs and file system. A sandbox has three kinds of analysis which are static, dynamic and hybrid analysis. Dynamic analysis has been chosen for this research that suitable for malware behavior analysis. As IoT botnet detection approach, graph-based method has been used in this research. There are two types of graph that consist in graph-based method which are static graph and dynamic graph. This research focuses on dependency graph in dynamic graph.
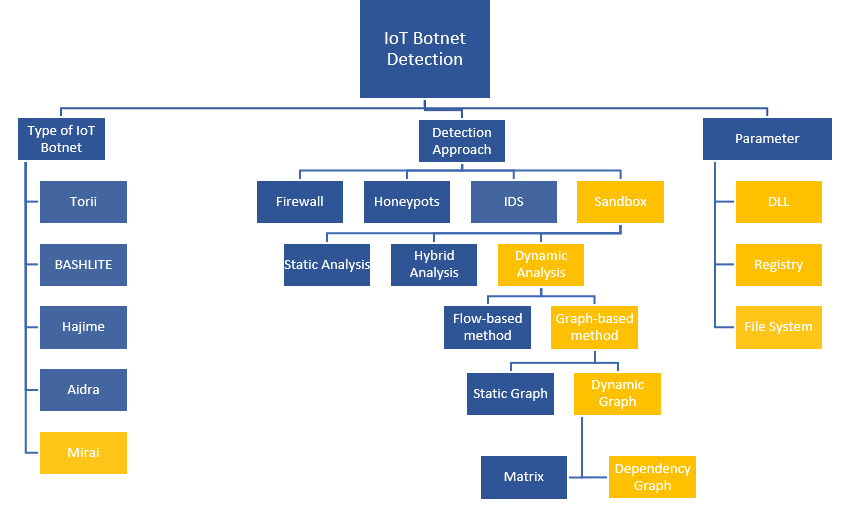
As prediction, IoT botnet operators will be getting more creative in their exploitation of wearables and connected home products. Mirai is just the first of a novel category of botnets that exploit IoT devices and systems. Mirai’s strategy is quite simple, it uses a list of common default usernames and passwords to gain access primarily to home routers, network-enabled cameras, and digital video recorders, which usually have less robust protection than other consumer IoT devices. According to Michele (2017), Mirai botnets managed to control remotely nearly half a million IoT devices, assembling a mighty botnet. Up to this moment, Mirai and its variants are accounted for some of the largest and most catastrophic DDoS attacks. Mirai daily basis statistics and an overview of data pertaining to Mirai C&C servers are provided by NetLab (2017). Another interesting IoT-powered worm that presents very similar behavior to Mirai, at least to its spreading functionality, yet far more sophisticated, was identified on Oct. 2016 by researchers in Rapidity Networks (Profetis, 2016). They coined it as Hajime, and according to their analysis, it seems that it kicked off a few days before the release of Mirai’s source code. All in all, it would not come as a surprise if in the near future we witness new strains of such malware families, which in addition will be capable of writing themselves to the device’s persistent filesystem like IoT devices (Georgios, 2017). These IoT Botnets also will be used for everyday DDoS (Distributed Denial of Service) attacks, payper- click fraud, and other wide-ranging cyber attacks.
Malware is rapidly spread especially IoT botnet that make the characteristics of a malware are difficult to identify and determine. This issue also leaded to difficulty to detect the IoT botnet behavior. Nowadays, malware has a heap of distinct kinds of malware and has its own attack pattern against systems and networks. Hence, the user needs to know the attack pattern to track the malicious activity before the attack happen. The project will take three objectives to guarantee that the project operates smoothly planted on the project issues in the preceding section. Firstly, this research can study the behavior of IoT botnet malware. Once the behavior of IoT botnet have been understood, this research can analyze the characteristics of IoT botnet behavior. Lastly, we can propose a graph theoretical detection method to detect IoT botnet malware more accurately. The scope of the initiative is indicated as i) Focusing on behavior in registry and file system of IoT botnet malware, ii)Focusing to analyze characteristics of IoT botnet malware behavior and iii) Focusing to analysis the IoT botnet malware using graph theory. Computer security threats widespread rapidly especially on a IoT devices that is one of the new technology nowadays. Thus, graph theory detection approach can help to prevent an attack from being started when a user knows the behavior and attack pattern for the IoT device.
One of the most important fields in discrete mathematics is graph theory. Graph theory is discrete structures, consisting a collection of vertices and edges that connect these vertices (Andrew, 2017). Problems in almost every conceivable discipline can be solved using graph models (Harith, 2017). Nowadays, graph theory has become a very critical component in many applications in the computing field including networking and security. The actual graph database technology is fairly nascent, really becoming prominent in the last decade. It is been driven by the cheaper costs of storage and computational capacity and especially the rise of Big Data. The general application of graph theory does not require a prior knowledge in mathematics. Graph analytics theory is enabling a much more agile approach when something of interest was identified there was an iterative process of query, analyze the results, refine the query, wash, rinse, and repeat. This process moves from taking days or hours down to minutes or seconds. The graph will quickly identify the known information but more importantly, the graph can identify what we do not know. The connection of related information helps represent the data visually and programmatically. All the attacks will be tracking by enrich the data with graph theory model . Angad et al. (2013) has provide optimal solutions and configurations to next generation malware filter based on graph-theoretic concepts to assess the importance of individual routers within the network by given a traffic pattern. Then, Jonathan et al. (2015) has review some of key applications of graph theory in network security and found that indeed graph theory can help the significant throughout benefit for contest distribution scenarios beyond cyber crime. It is prove that graph theory model has the ability to sort out anomalies by zooming the interesting associations like how the domains are associated with the same IP address or the same registrant email address. It is also can encode the causal relationship among vulnerabilities and tell whether critical assets are secure enough against ptential multi-step combining attacks. Therefore, at the end, all the IoT botnets attack hashes are recognized and has given the possibility of overcoming problems with sampling of normal traffic patterns such IoT botnets traffic activities and the ability to counter anomalies in the datasets.
The current motivation to do this project is the inspiration of researching graph theory model which enable high agile approach when something of interest was identified such as iterative process of query, analyze the results, and refine the query, wash, rinse, and repeat. With the information of the malware has been graphically visualize into graph, the process which involve algorithm to detect the botnet will become minimal and faster compare to traditional solution. Previous author also recommends graph theory application such as Angad et al. (2013) that provide optimal solutions and configurations to next generation malware filter based on graph-theoretic concepts to assess the importance of individual routers within the network by given a traffic pattern. Then, Jonathan et al. (2015) has review some of key applications of graph theory in network security and found that indeed graph theory can help the significant throughout benefit for contest distribution scenarios beyond cybercrime.
There are flow to complete the project. Figure 1.2 show the overall flow chart of the project activities. This flow chart is to make sure the research activities will done within the flow. At first, the theory of the IoT botnet and the algorithm/scheme need to identifies and search by making the paper review based on a bundle of research paper from journals and conferences. Then, firm and select the datasets for IoT botnets. After the dataset selection is done, the IoT Botnet testbed has been design. Meanwhile, for the selection of algorithm/scheme, the algorithm/ scheme need to be analyze first by doing the paper reviewed. Then, the best datasets, features, algorithm and graph theory scheme has been selected as the proposed research.
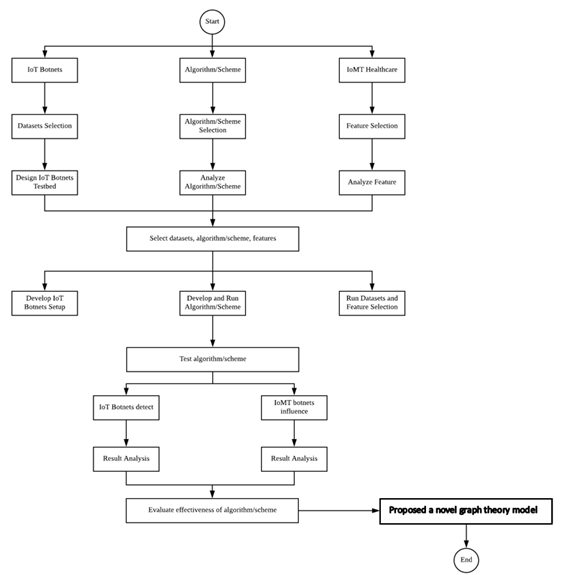
Next stage is to be develop the IoT Botnets setup, develop and run algorithm/ scheme and after that run the datasets and features selection. After the develop and run algorithm/ scheme is done then move to test algorithm/scheme. The testing is required to make sure the selection of the datasets, features, algorithm and graph theory scheme are suitable for this research. After testing the algorithm, the behviour of IoT botnets has been detected using reverse engineering approach in analysis phase. By detecting the behaviour the IoT Botnets, the result of analysis pattern has overcome. Then, the effectiveness of the algorithm/scheme has been evaluate. At last, this research will proposed a novel graph theory model.
Project Implementation
Internet of Things (IoT) is the network devices that certainly not another kind of innovation, it is the expansion of existing advancements; for example, a huge number of smart phones are associated by Wi-Fi or 3G systems, software, sensors and connectivity which allows to connect, interact and exchange data. IoT is one of the technologies that increase rapidly nowadays, and it became the target for attacker to exploit because of the lack security level in IoT devices. An IoT botnet is a gathering of hacked PCs, savvy apparatuses and Internet-associated devices that have been co-settled on illegal purposes. Botnet works by infecting internet-connected devices that come with a few vulnerabilities on that devices. From this issues, it is difficult to distinguish the characteristics of IoT botnet behavior and difficult to detect the behavior because of technology nowadays. Dependency graph approach is applied to analyze the behavior of IoT botnet and identify the pattern from similarity and dissimilarity for each malware. To complete the analysis of malware, a malware samples have being injected in Cuckoo Sandbox as a virtualized execution environment. After a graphs have been constructed, the rules extraction will be generated after analyze the similarity and dissimilarity of a graph. As a result, this approach could be used to obtain a new findings in graph-based method.
IoT security must become a priority and a significant component of security perimeter in every sector now. Security optimization can help close IoT vulnerabilities. With the immense number of IoT devices and the amount of data produce, it will likely be overwhelmed trying to manually manage and track it all. However, through the leverage graph analytics theory, the analyze data and network interactions can be done by determining safe device behavior. With this level of insight into general usage patterns, it becomes easier to identify abnormal activity and block harmful actions produce by IoT botnets attack. Thus, in this research, the objective will be to identify the behavior of IoT botnet using reverse engineering approach. From the behavior of the malware, this research will attempt to formulate a novel graph analytic theory model in detecting IoT botnets activities attack. Then, the model will be validate by improving the accuracy of IoT botnets detection. The expected output of this research is a scheme that is able to remove and quarantine the suspicious codes as well as able to detect the behavior changes in the IoT devices due to influence feature factor that is embedded inside the approach. The model also can be used for security tool community who want to get and discover the real behaviors of IoT botnets from the raw infection codes that exists in particular IoT devices and machines
The activity of this research is divided into five phase. The initial phase requires to study and addressing the problem that has been faced by IoT network which currently IoT botnets. Then, literature review will be focusing on IoT botnets, IoT devices and machine learning approach. The second phase which is data collection anad design requires a testbed environment setup in order to collect data of IoT botnets. These datasets that has been captured in testbed will be labelled with IoT botnets malicious traffic. The third phase is design and implementation phase which require captured dataset to be analyzed and will be compared to find distinctive behavior. Then, the new machine learning scheme with approximate scripting will be designed. In this phase, suitable influence feature factor has also been identified. The researcher will develop and run IoT botnets detection model using graph analytics theory model in phase four which is developing the new model. Lastly in testing and evaluation of result phase, the researcher tests the new graph analytics theory model with the selected influence feature factor to validate the result of detection either it was effective or not.
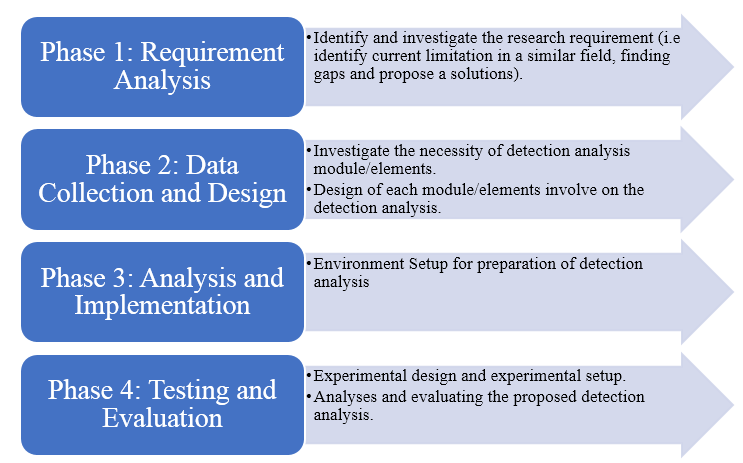
2.2.1 Phase 1: Requirement Analysis
This phase started with gathering all information about IoT botnet after the topic has been selected. This is an important phase that need to be conducted in this project. This phase is about referring all studies done by past researcher that related to my current research. The studies and references gathered are related to the study of IoT, malware, botnet, IoT botnet detection technique, network traffic and potential attack on IoT. The result of the study conducted will be utilized in the following phase which is the analysis phase. To make the project more understandable, the past research paper related to this project will be used as a reference. After reading and comparing the findings, methods and techniques to be used by other researchers for the project will be finalized and selected. This phase is the most important in rationalize the research.
2.2.1.1 IoT Botnets
Security and privacy issues concerning computer networks are always increasing in the worldwide scenario. Computer security has become an obligation in daily life owing to the generation of intelligence techniques. The development of Internet accesses and the new approaches such as Internet of Things is increasing nowadays (da Costa, Papa, Lisboa, Munoz, and de Albuquerque, 2019). The Internet of Things (IoT) is a mechanism connected with computer systems, objects, electronic and mechanical machines, animals or individuals presented with unique identifiers (UIDs) and the ability to communicate information over a network without involving human-to-computer or human-to-human communication.
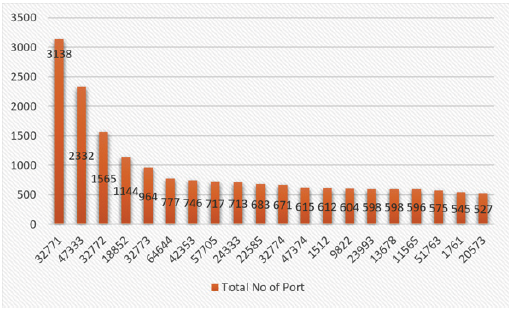
A botnet is a robot network of compromised machines or bots running malicious software under a botmaster’s command and control (C&C). Botnets have a wide variety of heinous purposes including email spam delivery, distributed denial-of-service (DDoS) attacks, cryptocurrency mining, password cracking and key logging. In September 2016, there is one of the biggest attacks on record, which is a botnet attack that constructed from the Mirai malware flooded the DNS provider Dyn with a DDoS attack exceeding 620Gbps. It dispersed by scanning IoT devices and deducting the administrative credentials by brute force and more than 380,000 IoT devices were enslaved by Mirai malware on October 2016 (Li, Li, Wang, Sun, and Alam Bhuiyan, 2018)(Edwards and Profetis, 2016). Based on the (Sahrom and Roziah, 2017), Mirai infection is by port number.
With the IoT’s latest fast growth, there has been growing interest in understanding emerging cyberthreats in IoT. IoT devices are extremely susceptible and appealing to attackers to their highly heterogeneous parts, unsophisticated safety settings and weak encryption verification(Bhuiyan et al., 2017)(Constantinos Kolias, Georgios Kambourakis, Angelos Stavrou, and Jeffrey Voas, 2017). The big amount of insecure IoT devices makes them low-hanging targets for attackers to generate large-scale botnets (Constantinos Kolias et al., 2017).
The report that gives some interesting statistics about the DDoS attacks shown in Q2 2018 in (Lawrence, 2018). The top 3 DDoS attack vectors seen by NexusGuard are UDP (31.56%), TCP Syn (18.50%), and ICMP (9.32%). The grand total of the three major attack kinds is 59.38%. The Single vector attacks accounted for 52.03% of the total attacks, while 47.97% were multi-vector attacks. The top 5 multi-vector attacks were NTP amplifications + UDP (17.06%), ICMP + UDP (9.41%), ICMP + UDP + NTP Amplification (6.47%), CLDAP Reflection + UDP Fragmentation (5.29%), and TCP SYN + UDP (4.71%). While 55.28% of the attacks lasted less than 90 minutes, the average duration was 318.10 minutes long. The higher average is due to some days-long attacks, with the longest one being 6 days, 5 hours, and 22 minutes. 64.13% of attacks were less than 10 Gbps, but the average size was 26.37 Gbps. NexusGuard states that a surge in attack sizes greater than 10 Gbps in Q2 2018 accounts for the larger average size. The United States was the largest source of attacks at 20%, followed by China, France, Germany, and Russia.
2.2.1.2 Environment Setup
All the software and hardware used will be listed down in this phase:
a. Setup Environment
The Cuckoo Sandbox will be mounted in this initiative on the Debian Desktop. The Dell Precision Tower 5810 will be the software used. Table 2.1 below shows the information of the Dell Precision Tower 5810.
Table 2.1: Dell Precision Tower 5810 Specifications
| Specification | Details |
| Processor | Intel xeon e5430/2.66 ghz quad-core 1333mhz |
| Cache memory | L2 cache – 12 mb |
| Storage | 4tb raid 0, raid 1 |
| Memory | 32 gb fb-dimm 240-pin |
| Ram | 16gb |
| Networking | Ethernet, fast ethernet, gigabit ethernet |
b. Installation of Cuckoo Sandbox
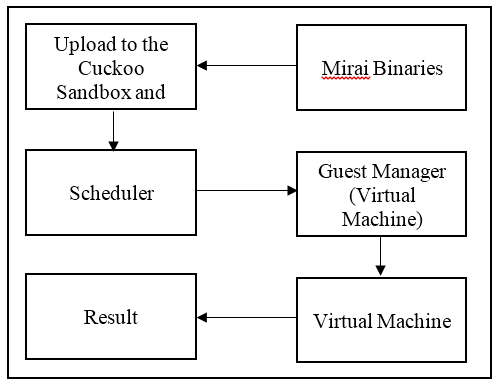
Cuckoo Sandbox will be installed after setting up the environment. The Cuckoo Sandbox Architectural design are shown in Figure 4.1. In this module, the IoT botnet will be uploaded to Cuckoo Sandbox. Cuckoo then will execute its Guest Manager to check available Virtual Machine. Any available Virtual Machine will be chosen to run the IoT botnet. After the analysis process has completed, Cuckoo will produce result in form of report.
c. Executing Malware Analysis
After the Cuckoo has successfully been setup, the software will be tested by running malware samples. The malware activities will be captured regarding the accessed API. In this topic, it will discuss about analysis flow to reach the rules extraction. Malware attackers use several techniques of obfuscation such as domain generation, domain fluxing and more. To create it even more difficult for anti-virus products to detect their infrastructure. Some malware leverages existing innocent server’s safety vulnerabilities to distribute the real malicious code. This usually makes malware detection difficult for anti-virus products when they are hosted on legitimate servers.
After running the sample, the report produced by cuckoo has several analytical reports. The report to be analyzed in this research is the behavior analysis. Then, there was plenty of process and detection sources that were born with the malware in the behavior analysis report. Then, svchost.exe are the process to take their registry as sources of detection. The Windows API, informally WinAPI, is the key set of application programming interfaces (APIs) accessible in the operating systems of Microsoft Windows. Collectively, the name Windows API relates to several distinct platform applications often referred to by their own names (e.g. Win32 API); see the section on variants. Nearly all Windows programs communicate with the Windows API. A tiny amount (such as programs launched early in the Windows startup process) use the Native API on the Windows NT operating system line.
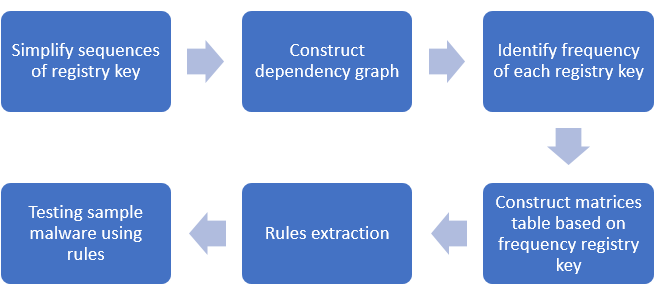
The process which is svchost.exe that been chosen in this study because it is DLL files which not an independent executable file. This process also ran all running programs on computer. Besides, there are a resource that stated normal or benign svchost.exe process than infected process. Due to this, if there is differences registry key in this process, it may be a malicious activity in that process. For analysis, svchost.exe process have chosen for all sample malware. Then, picked the same Process ID (PID) from each samples of malware for example, PID: 872. There are six stage to complete the analysis as represented in Figure 2.4 that show the flow of analysis.
2.2.2 Phase 2: Data Collection and Design
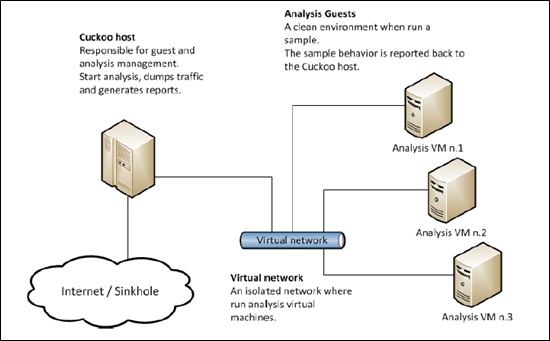
In this phase, it shows the logical design of the Cuckoo Sandbox environment as attach in Figure 2.5. When a file or an url is submitted to the Cuckoo Host, a new entry will be made in the database after submission of a file or URL and a task ID will be generated. For this new task, the entry contains information about what the target (the object to be analysed) is and the configured and specified analytical preferences. Cuckoo will inject the uploaded malware into analysis virtual machine. Then, it will produce a report containing the logs of the malware and its behavior.
2.2.3 Phase 3: Analysis and Implementation
This method used to detect the behavioral of IoT botnet in file system and registry location that using Cuckoo Sandbox. Figure 2.6 illustrate the flow of malware injection and generating report. Each step of the flowchart will be explained below.
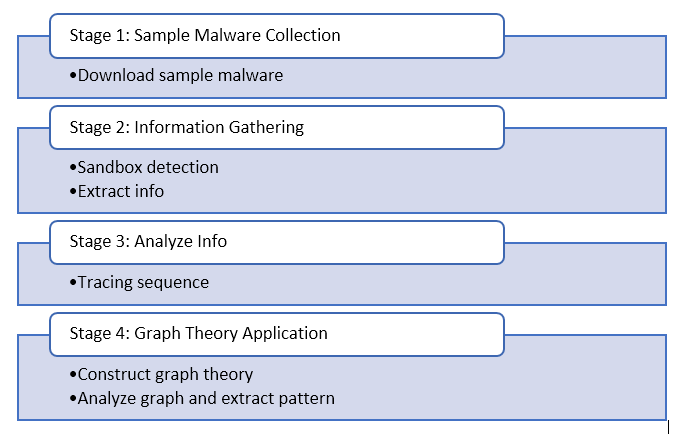
2.2.3.1 Stage 1: Sample Malware Collection
In sample malware collection stage, it will explain the details of malware collection, sources of malware and architecture of the chosen malware. There malware samples that will be tested in this project. The sample that the study focus is Mirai in this study. The primary sources for downloading the entire sample were through the website of VirusShare.com. The MD5 sample will be searched in Virustotal.com in order to validate the sample. To run the study, the complete sample is 10 sample, which must be in the same variant (Mirai).
| Registry key | Descriptions |
| HKEY_LOCAL_MACHINE\Software\Microsoft\Windows\CurrentVersion\WindowsUpdate | Windows update may could be modified to close the auto update of Windows. So, there will have some vulnerable in that Windows machine. |
| HKEY_LOCAL_MACHINE\Software\Microsoft\WBEM\CIMOM | CIMOM registry key is normal for every svchost.exe process, but it could be malicious when there is deleted registry key of CIMOM |
| HKEY_LOCAL_ MACHINE\System\CurrentControlSet\Services\Tcpip | This registry key is the most important key for Mirai access due to the behaviour of Mirai that have been mentioned in sub-topic 5.2. |
2.2.3.2 Stage 2: Information Gathering
In this stage, will discuss about the process of sandbox detection using dynamic analysis. Cuckoo Sandbox will be used as a platform to analyze malicious file under Linux operating system. Cuckoo Sandbox is one of the open source automated malware analysis system that can provide a detailed report of network, behavioral for each malware that have been analysed. After malware have been injected, it will show a result of malicious that captured in malware file.
2.2.3.3 Stage 3: Analyze Info
After gather the information from Cuckoo, the information will be analyzed by trace the sequence of for each cycle. In this project, focusing windows registry is svchost.exe process. In this research, comparison between benign and malicious process have been analyzed as presented in Table 2.2 and Table 2.3.
Table 2.2: Benign process of svchost.exe
| svchost.exe | RegCreateKey | HKLM\Software\Microsoft\WBEM\CIMOM | Success |
| svchost.exe | RegCloseKey | HKLM | Success |
| svchost.exe | RegSetValue | HKLM\SOFTWARE\Microsoft\WBEM\CIMOM\ConfigValueEssNeedsLoading | Success |
| svchost.exe | RegCloseKey | HKLM\SOFTWARE\Microsoft\WBEM\CIMOM | Success |
| svchost.exe | RegOpenKey | HKLM | Success |
| svchost.exe | RegQueryKey | HKLM | Success |
| svchost.exe | RegCreateKey | HKLM\Software\Microsoft\WBEM\CIMOM | Success |
The highlighted row in Table 2.3 shows the deleted registry key of HKEY_LOCAL_MACHINE\SOFTWARE\Microsoft\WBEM\CIMOM\LastServiceStart. It shows a different from process in Table 2.2. so, it could be a malicious activity.
Table 2.3: Malicious process of svchost.exe
| API | ARGUMENTS | STATUS |
| RegCreateKeyExW | Handle: 0x00000ad4 FullName: HKEY_LOCAL_MACHINE\Software\Microsoft\WBEM\CIMOM Access: KEY_QUERY_VALUE|KEY_SET_VALUE Registry: 0xffffffff80000002 Disposition: REG_OPENED_EXISTING_KEY Class: SubKey: Software\Microsoft\WBEM\CIMOM | Success |
| RegSetValueExW | Handle: 0x00000ad4 Buffer: 2019/8/3 13:19:35’693 BufferLength: 44 ValueName: PreviousServiceShutdown Type: REG_SZ FullName: HKEY_LOCAL_MACHINE\SOFTWARE\Microsoft\WBEM\CIMOM\PreviousServiceShutdown | Success |
| RegDeleteValueW | Handle: 0x00000ad4 FullName: HKEY_LOCAL_MACHINE\SOFTWARE\Microsoft\WBEM\CIMOM\LastServiceStart ValueName: LastServiceStart | Success |
| RegCloseKey | Handle: 0x00000ad4 | Success |
2.2.3.4 Graph Theory Application
In this stage, a collection of malwares report that had been collected from Cuckoo Sandbox are analyzed in order to identify the similarity, dissimilarity behavior of botnets studied. A detection and analysis IoT botnet are analyze using graph theory method. A report that have been sorted by API will manually being analyze using this method based on the features that had been chosen in the literature review. After construct graph, it will show the most frequent and less frequent path from the graph. Then, matrices will be constructed using five malwares for training malware and another five for testing. From five training malwares, rules of detection could be extracted.
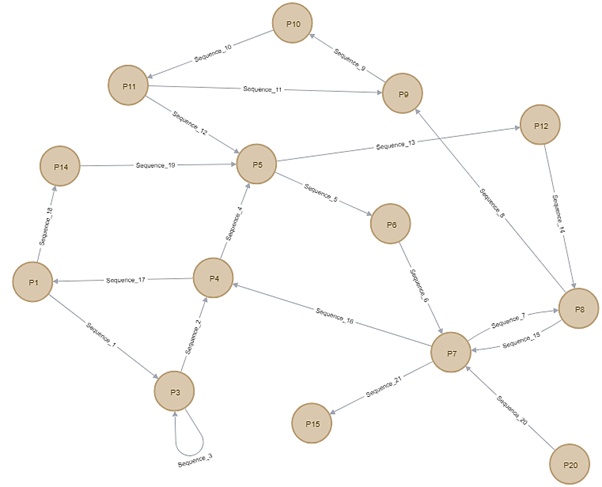
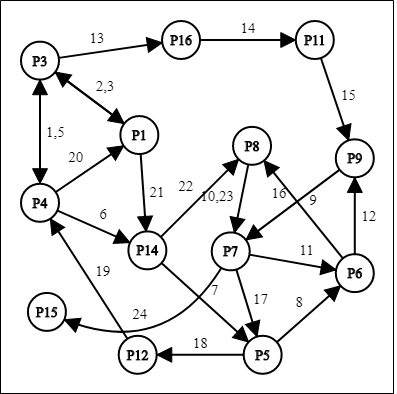
Figure 2.7 shows a full cycle of Malware 1 starting with node P1 as the node representing registry key of “Hkey_local_machine\software\microsoft\windows nt\currentversion\schedule” getting accessed by the malware. There are 14 path nodes and 21 edges representing sequences between multiple path nodes. The highlighted node from Figure 1 are P5 and P7 nodes since it has highest frequency of registry value among other nodes that has been accessed by the Malware 1 which are 3 times.
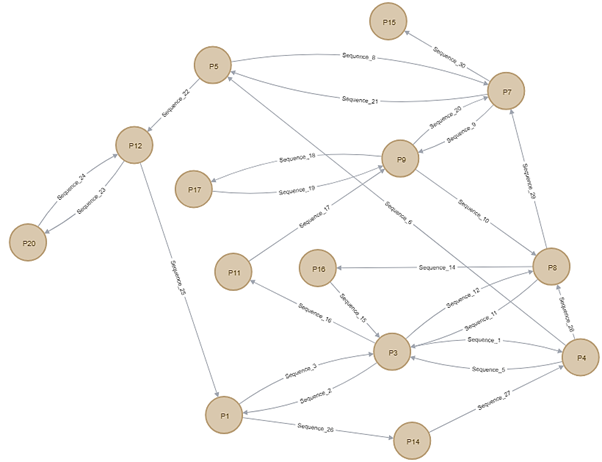
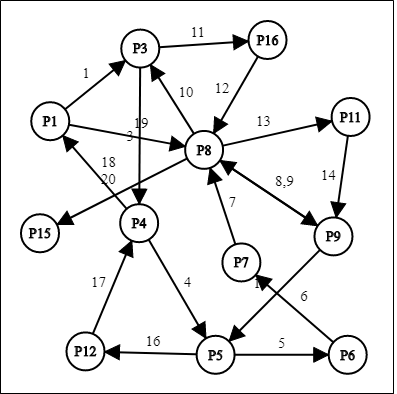
Figure 2.8 shows a full cycle of Malware 2 starting with node P3 as the node representing registry key of “Hkey_local_machine\software\classes” has been first node to be accessed. There are 14 path nodes and 27 edges representing sequences between multiple path nodes. The highlighted node from Figure 1 is P3 node since it has highest frequency of registry value among other nodes that has been accessed by the Malware 2 which are 4 times.
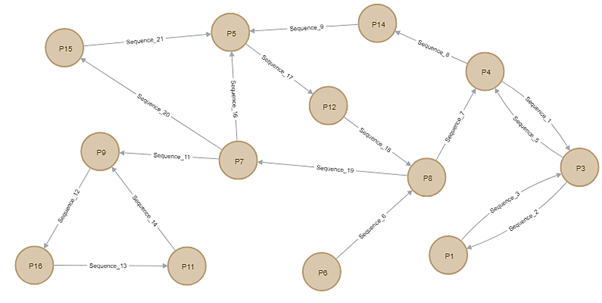
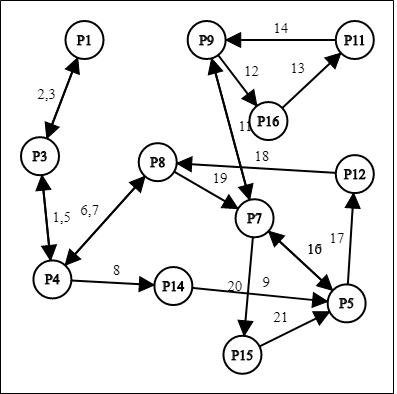
Figure 2.9 shows a full cycle of Malware 3 starting with node P4 as the node representing registry key of “Hkey_local_machine\software\microsoft\windows\currentversion\windowsupdate”. There are 13 path nodes and 18 edges representing sequences between multiple path nodes. The highlighted node from Figure 1 is P5 node since it has highest frequency of registry value among other nodes that has been accessed by the Malware 3 which are 3 times.
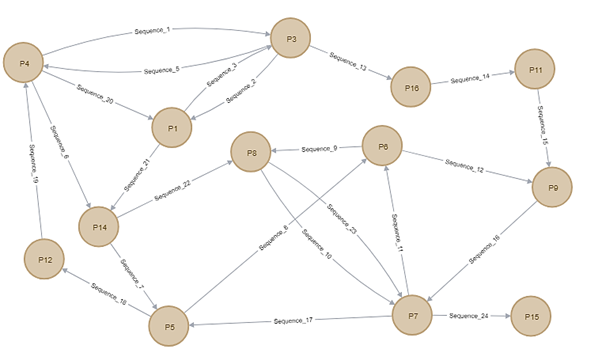
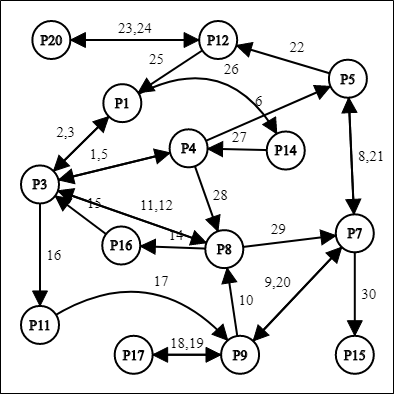
Figure 2.10 shows a full cycle of Malware 4 starting with node P1 as the node representing registry key of “Hkey_local_machine\software\microsoft\windows\currentversion\windowsupdate”. There are 13 path nodes and 23 edges representing sequences between multiple path nodes. The highlighted node from Figure 1 are P1, P3, P4, P5, P6, P7, P8, P9, P14 nodes since it has highest frequency of registry value among other nodes that has been accessed by the Malware 4 which are 2 times.
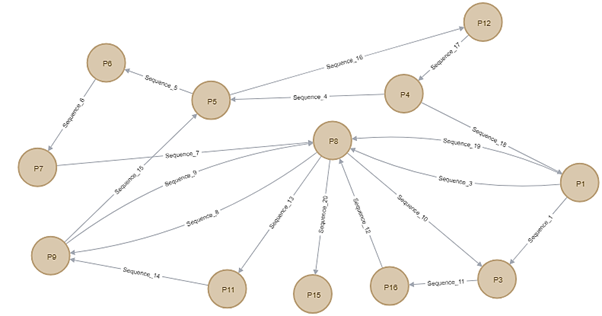
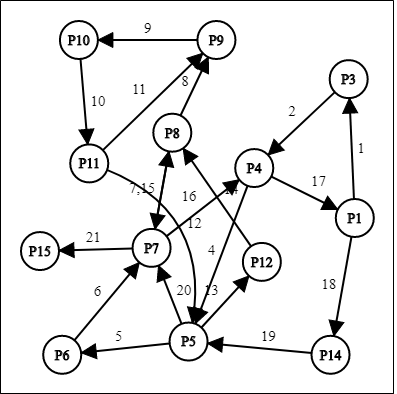
Figure 2.11 shows a full cycle of Malware 5 starting with node P1 as the node representing registry key of “Hkey_local_machine\software\microsoft\windows nt\currentversion\schedule”. There are 12 path nodes and 19 edges representing sequences between multiple path nodes. The highlighted node from Figure 1 is P8 node since it has highest frequency of registry value among other nodes that has been accessed by the Malware 5 which are 4 times.
2.2.4 Phase 4: Testing and Evaluation
Under this phase, verification will be done to verify whether the attributes will generate the correct attack pattern or vice versa. In testing phase, comparison will be made between selected sample malwares. In this graph based, the research uses the directed graph method. A dependency graph (or directed) is a set of vertices and a collection of directed edges that connect a pair of vertices ordered by each. It’s a pointing edge from the pair’s first vertex and points to the pair’s second vertex. This section will discuss the training and testing malware that have been used to get a result of graph theory approach. In this section, the registry key in process svchost.exe listed in Table 2.4, and the path indicates as their ID that will be used in the representation of graphs.
| Path | Registry Key |
| P1 | Hkey_local_machine\software\microsoft\windows nt\currentversion\schedule |
| P3 | Hkey_local_machine\software\classes |
| P4 | Hkey_local_machine\software\microsoft\windows\currentversion\windowsupdate |
| P5 | Hkey_current_user\software\microsoft\windows\Currentversion\explorer\shell folders |
| P6 | Hkey_local_machine\software\microsoft\Tracing\iphlpsvc |
| P7 | Hkey_local_machine\system\currentcontrolset\Services |
| P8 | Hkey_local_machine\software\microsoft\rpc\Securityservice |
| P9 | Hkey_local_machine\software\microsoft\wbem\Cimom |
| P11 | Hkey_local_machine\software\microsoft\wbem\Transports\decoupled\server |
| P12 | Hkey_local_machine\system\currentcontrolset\Services\tcpip |
| P14 | Hkey_local_machine\software\policies\Microsoft\windows\windowsupdate |
| P15 | Hkey_local_machine\system\controlset001\Services\mmcss |
| P16 | Hkey_local_machine\software\microsoft\Wbem\ess |
| P17 | Hkey_local_machine\system\controlset001\Services\tcpip |
| P18 | Hkey_local_machine\system\setup |
The graph displays the full cycle of the method that is svchost.exe referring to the behaviors analysis report (registry) from the start of the first registry key until the last of registry key and task ID(TID) before DDOS attack being launched. The edges in the graph represented as sequences of svchost.exe process. Figure 2.12, Figure 2.13, Figure 2.14, Figure 2.15 and Figure 2.16 is the full cycle for svchost.exe for five training malwares to create matrices and extract rules for testing phase of malware.
After dependency graph being constructed, it will show the most frequent of registry key accessed represented in matrices as shown in Table 2.5.
Table 2.5: Frequency of registry key
| Registry key (path) | M1 (549f1332ae169d98648bfaa0d8f1af9) | M2 (f5660b1ccad67b08f6ece03c625e469) | M3 (7a44108b25ofc4d502676o2988f7ofa) | M4 (10a3eddd2d4716375becd54b3050cf2) | M5 (ff905b3164ab0a36fa07623020d47e0) |
| P1 | 1 | 2 | 1 | 2 | 1 |
| P3 | 2 | 4 | 2 | 2 | 2 |
| P4 | 2 | 2 | 2 | 2 | 2 |
| P5 | 3 | 2 | 3 | 2 | 2 |
| P6 | 1 | 0 | 0 | 2 | 1 |
| P7 | 3 | 3 | 3 | 2 | 1 |
| P8 | 2 | 3 | 2 | 2 | 4 |
| P9 | 2 | 2 | 2 | 2 | 2 |
| P11 | 1 | 1 | 1 | 1 | 1 |
| P12 | 1 | 1 | 1 | 1 | 1 |
| P14 | 1 | 1 | 1 | 2 | 0 |
| P15 | 1 | 1 | 1 | 1 | 1 |
| P16 | 0 | 1 | 1 | 1 | 1 |
From Table 2.6 that represented as matrices shows that there are four(highlighted) registry key that have the same frequent for all training malware such P4, P9, P12, and P15. The highlighted row is the registry key that have the same frequent for all training malware such P4 (HKEY_LOCAL_MACHINE\Software\Microsoft\Windows\CurrentVersion\WindowsUpdate), P9 (HKEY_LOCAL_MACHINE\Software\Microsoft\WBEM\CIMOM), P12 (HKEY_LOCAL_ MACHINE\System\CurrentControlSet\Services\Tcpip), and P15 (HKEY_LOCAL_MACHINE\ SYSTEM\ControlSet001\services\MMCSS). Due to this frequent of registry key from above matrices table, it can be concluding the rules of extraction of this malware. The rules of extraction being constructed based on the same frequent of four registry key that mentioned before. The registry key has been analyzed using five training Mirai malware on svchost.exe process. Therefore, the rules extraction represented in Table 2.6 to remark as Mirai or malicious
Table 2.6: Rules of extraction
| No | Rules | Remarks |
| 1 | If p4, p9, p12 and p15 exists in svchost.exe process, then it is mirai | Infected by Mirai |
| 2 | If p4, p9 and p12 exists in svchost.exe process, then it is malicious | Take an action for prevention |
| 3 | If p4, p9 and p15 exists in svchost.exe process, then it is malicious | Take an action for prevention |
| 4 | If p9, p12 and p15 exists in svchost.exe process, then it is malicious | Take an action for prevention |
| 5 | If p4 and p9 exists in svchost.exe process, then it is malicious | Take an action for prevention |
| 6 | If p9 and p12 exists in svchost.exe process, then it is malicious | Take an action for prevention |
| 7 | If p9 and p15 exists in svchost.exe process, then it is malicious | Take an action for prevention |
There are five malware samples have been analyzed using rules extraction that constructed before. The Table 2.7 shows testing of malware using rules.
Table 2.7: Malware Testing
| Registry Key (Path) | M1 (9eb17dbb2fb3e88ceb8537b083a5f7d) | M2 (abf2d77fabd726dc5b781179416e0a9) | M3 (10a3eddd2d4716375becd54b3050cf2) | M4 (dd257d9d3d6428897730de4df3d50) | M5 (8f628545edee75cc1613365127590f5) |
| P4 | yes | yes | yes | yes | no |
| P9 | yes | yes | yes | yes | yes |
| P12 | yes | yes | yes | yes | yes |
| P15 | yes | yes | yes | yes | yes |
Therefore, 4 out of 5 testing malwares fulfil rules No. 1 which is all registry key exists and have frequent. So, it can be concluded that M1, M2, M3 and M4 are Mirai, but 1 testing malware(M5) only fulfil 3 out of 4 registry keys. Due to this, it can be concluded that M5 is malicious and must take action and concern for early detection. As the goal of this studies to achieve the rules extraction of malware behaviors and also to achieve the similarity of each malware sample. Based on the study conducted, the sample of malware has its own behaviors but also has dissimilarity. The cycle of svchost.exe from start until registry key before attack being launched is different with another sample. In other words, the behaviors of malware on the cycle of svchost.exe will be the same due to the 4 registry keys that must be in the sequence of that process.
The analysis and implementation utilizes the topic of graph-modeling in this project to define patterns of malware conduct based on Virusshare samples. The study produces a graph identifying the malware’s conduct. Research results show that the malware has its distinctive conduct, somehow the similarity still appears. The registry key frequency is the important to building the pattern of Mirai malware. The approach is also essential in researching some malware’s architecture and revealing prevalent malware patterns. Thus, these findings demonstrate the technique’s precision and effectiveness with information on the classification of real-world malware.
Project Evaluation
Currently, the research has been proceed into researching behavior of IoT botnet by doing literature review. With this literature review, the researcher can make comparative analysis using previous researcher journal and paper. With the current progress, comparative analysis with previous solution can be made for IoT community in future guide. This will help the research to have deep knowledge in behavior of IoT botnets before data collection phase. Furthermore, novel theories or new findings can be found during research which can further the progress of the research. This research also has potential to collaborate with government agencies such as Cyber Security Malaysia in designing testbed of IoT botnets attacks. During current phase, the researcher will have several insight that can help to identify behavior of IoT botnets thus, able to develop graph analytics theory model.
This section discussed related studies on detection IoT Botnet in network traffic and using graph-based method. According to (Elovici et al., 2018), IoT devices is more easily to compromised than desktop computer and it increasing of IoT-based botnet attacks. A researcher proposed a new method to discover this kind of problem which is propose a novel network-based anomaly detection method for the IoT. This method can extract behavior snapshots of the network and use deep autoencoders to detect anomalous network traffic from infected IoT devices. In this research, a researcher using their own data collection of network traffic using port mirroring on the switch. They use nine IoT devices and inject IoT botnet on it. They launched the Mirai and BASHLITE attacks on their IoT device and they capture the traffic data before and after infection. The result of this method that have been analyzed and it show high True Positive Rate (TPR) is 100%. This method also raised the fewest false alarms and it demonstrated False Positive Rate (FPR) of 0.007. The advantage of this method is generating an accurate result of detection. Besides, heterogeneity tolerance addresses the growing heterogeneity of IoT devices. It also trained to detect when a behavior is abnormal can detect previously “unseen” botnet behavior. In term of efficiency, this method does not jeopardize their functionality or impair their lifespan and does not consume any computation, memory or energy resources from IoT devices.
Most of the researcher use network traffic as a detection sources to detect botnet as used by (Cid-fuentes, Szabo, and Falkner, 2018). A challenge that researcher faced is high computational requirements of processing large amounts of network information. In address this problem, a researcher by scalable and decentralized framework that can discover unseen botnet traffic. This research use network-based detection method. For their experiment, ISCX botnet dataset has been used that consists of combination of three other dataset and contain traffic from 16 different IRC, P2P and HTTP based botnets. As a result, it shows TPR of 100% and 0.082% of FPR. This method significantly improves the results reported by similar works on the same dataset. The disadvantage, it generates a high FPR for ISCX dataset.
According to (Chen and Lin, 2014), botnets are difficult to discover their existence. Most of the time, botnets use IRC as a communication channel. A researcher proposed anomaly score-based botnet detection to identify the botnet activities by using similarity and characteristics of botnets. In this research, it uses a few different datasets in order to proof their method, and the result shows TPR over than 90% and FPR below than 7%. According to (Gu, Perdisci, Zhang, and Lee, 2015), most of the botnet detection approaches only on specific botnet C&C protocols and structure. In this paper, a researcher approaches a general detection framework that is independent of botnet C&C protocol and structure and requires no a priori knowledge of botnets that captured bot binaries and botnet signatures. In this paper, BotMiner do passive analyze network traffic in the monitored network to detect compromised machines that may be a part of botnet. In this case, it uses network traffic to observe a traffic like a most researchers do. To complete this research, a researcher test performance on several network traffic from their campus network and collected botnet data. From the result of this research, they get high TPR and for FPR. A weakness of this method, BotMiner is not complete.
Based on the (B and Lim, 2019), most of the malware attacks on IoT devices is Mirai such IP cameras, DVRs and routers in large-scale networks. In this paper, researcher developed a network-based algorithm to detect IoT bots that infected by Mirai or similar malware. This algorithm able to scan network for vulnerable IoT devices before it involved in actual attack using scanning matrix. Firstly, a researcher analyzes the traffic signatures produced by Mirai malware that infecting IoT devices to identified signatures that can be used to detect the presence of Mirai in devices. Then, network-based algorithm will be used to detect Mirai malware that based on a novel two-dimensional sampling approach. The experiment uses 100 IoT devices and it provide 40% of vulnerable devices after scanning. According to (Nguyen, 2018), IoT devices are increasingly being implemented in different domains and for distinct purposes. A researcher from this article claimed convolutional neural networks (CNN) being proposed to overcome the issue of heavy manually task of characteristic extraction. This approach used to identify malware without extracting pre-selected characteristics. Combining PSI graph and CNN classifier is the entire novel strategy for identifying malware in IoT devices. To complete the experiment of this approach, it uses 10033 ELF includes 4002 IoT botnet samples and 6031 benign. As a result, it demonstrates that PSI graph CNN classifier achieves 92% precision and a F-measure of 94%.
Table 3.1: Summary study of IoT botnet detection approaches
| Author | Title | Method | Detection Sources | Description | Result |
| (Elovici et al., 2018) | N-BaIoT—network-based detection of IoT botnet attacks using deep autoencoders | Network-based anomaly detection method | Network traffic | This approach extracts behavior snapshots of the network and use deep autoencoders to detect anomalous network traffic | 100% accuracy |
| (Cid-fuentes et al., 2018) | An adaptive framework for the detection of novel botnets | Network-based botnet detection | Network traffic | The proposed method to solve problem of unseen botnet traffic. | 100% accuracy |
| (Chen and Lin, 2014) | Detecting botnet by anomalous traffic | Anomaly score based botnet detection.IRC-based botnet detection. | Network traffic (IRC traffic) | This method is proposed to identify botnet activities using similarity measurement and periodic characteristics of botnets. | 90% accuracy |
| (Gu et al., 2015) | Botminer: clustering analysis of network traffic for protocol-and structure-independent botnet detection | Clustering analysisPassive analysesC-plane clusteringA-plane clustering | Network traffic | To detect groups compromised machines within a monitored network that are part of a botnet | 75% accuracy |
| (B and Lim, 2019) | Early detection of Mirai-like IoT bots in large-scale networks trough sub-sampled packet traffic analysis | Network-based algorithmScanning matrix | Network traffic (large-scale networks) | To detect IoT bots infected by Mirai or similar malware in large-scale networks.Using scanning matrix for vulnerable and non-vulnerable devices. | 100% accuracy |
| (Nguyen, 2018) | Iot botnet approach based on PSI graph and DGCNN classifier | -Deep graph convolutional neural network classifier(DGNN) based detection-PSI graph | Network traffic | This paper proposed combination of PSI graph and CNN to detect malware in IoT devices. In ELF file, a cfg is served as a base for generate psi graph, then use DGCNN for training and testing psi graphs. | 92% accuracy (CNN classifier)94% accuracy f-measure |
Most of the latest botnet detection approach is using a graph-based method as same as (Daya et al., 2019). Botnet detection system mostly high computational overhead and do not completely capture the network communication patterns which is a flow-based approaches. This purpose of this research is to prunes presumable benign hosts and to achieves botnet detection with high precision. In this paper, a researcher uses two phased which are graph-based bot detection which leverages both unsupervised and supervised Machine Learning. This system can detect multiple types of bots and robust to zero-day attacks. A dataset that they use to achieve their objective is CTU-13 that have 13 different subset datasets including captures from 7 distinct malware, performing port scanning, DDoS, click fraud, spamming, etc. for overall result, the TPR shows high result and low FPR.
Based on the researcher (Ding, Xia, Chen, and Li, 2018), graph-based detection method that focus on dependency behavior graph also called as directed behavior graph has been used for that research. Dependency graph used to identify a node that uses the name of API call for each node in a graph. Dynamic taint analysis technique has been implemented in this research to find the relations between system calls. A researcher also proposed an algorithm to extract the common behavior graph by using graph matching algorithm that depends on the maximum weight subgraph to detect malicious script. For overall result, the result is high true positive which is more than 80% true positive rate and less than 20% false positive rate. According to (Li et al., 2018), a researcher uses matrix with resort to the graph-based clustering approach to cluster the attacker activities. To implement this method, a researcher deployed 10 honeypots in real-world environment started from November 2016 until April 2017 as their datasets. 241,963 attacks have been collected from the analysis period. After do the experiment and analysis using graph-based clustering approach, the result shows high accuracy.
Based on the research by (Nikolopoulos and Polenakis, 2017), dependency graphs (ScD-graphs) has been used to determine whether a program is malicious or benign a researcher also propose the similarity metric for detection process. In this research, 2631 malware samples pre-classified into 48 families of malware have been tested. An experiment also testing on unknown sample file. A result from this method, it achieved 94.70% true positive and 13.10% false positive. A graph-based malware activity detection are proposed by (Lee and Lee, 2014) to achieve robustness against evasion techniques. This method used to detect infected clients and malicious domain names in DNS traffic. Four sets of DNS traffic that captured from ISP networks have been used to do an experiment for this method. As a result, the method achieved high true positive which is more than 80% precision and less than 0.5% FPR.
According to (Nagaraja, 2014), detection on P2P botnets become a problem. A researcher use graph based analysis method to detect P2P botnets. They use two techniques which is the first technique exploits a fundamental property of botnet design and second using structured graph analysis to analyze behavioral. A source that they use is network traffic(P2P traffic). To complete this experiment, a researcher created a testbed of 25 servers within a test network connected to the Internet. The hosts seeded with sample known botnet such as Zeus, Miner and Spyeye and moved it from centralized C&C servers to P2P communication. Zeus and Syeye are designed to steal banking information and Miner steals Bitcoin credentials. The monitor a traffic and analyze it within five weeks. The result shows high false positive rate (the fraction of non-bot nodes that are detected as bots) which is below than 0.1%, but the result shows high true positive rate, not less than 94%. The advantage of this method can be used for large traffic volumes. A weakness of this method is less accurate in detecting P2P botnet.
A graph-based classification method that used by (Iliofotou et al., 2011) in their framework to detect P2P traffic already proof when the result shows 95% of TPR. In this paper, a researcher proposes Traffic Dispersion Graphs (TDGs) to remedy limitation of current traffic classification which are flow-based, payload-based and host-based. In this paper, a researcher uses network-wide behavior to assist in classifying traffic. A dataset that they use to complete this research are three backbone traces from a Tier-1 ISP and the Abilene (Internet2) network.
According to (Park, Reeves, Mulukutla, & Sundaravel, 2010), the proposed method is classification method based on the maximal common subgraph detection. A graph is consulted by capturing system call in sandbox environment. The method has been tested on 300 malware samples that consist of 6 families of malware. A result from this method shows that TPR is high and FPR is low. The approach introduced by (Shang, Zheng, Xu, Xu, & Zhang, 2010) is to measure relation between two binaries using a function-call graph A researcher then recommended a mechanism of graph matching to calculate relation between two binaries as well. It used malware samples obtained by VX Heavens for this study. Using a FIFO feature queue, this article had used a novel strategy. This paper also used a novel approach by using a FIFO function queue. The result shows that high TPR and low FPR.
According to (Camelo, Moura, & Krippahl, 2010), they use machine learning for classifying domain names as being generated by domain generation algorithm (DGA). Besides, they also use clustering algorithm to group network communication with similar patterns and lastly graph-based as a framework to store processed data. As a benign dataset, they use the top 10,000 domains from Alexa and 10,000 DGA domains provided by AnubisNetworks as an anomalous dataset. As a result, it gets 77,9% precision for machine learning classifier and approximately 9.32 for clustering algorithm.
Table 3.2: Summary study of graph-based analysis approach
| Author | Title | Method | Detection Sources | Description | Data sets | Result |
| (Daya et al., 2019) | A graph-based machine learning approach for bot detection | -graph-based method supervised machine learning-graph-based method unsupervised machine learning | Network traffic | Using two-phased which is unsupervised (phase 1) and supervised (phase 2) ml to analyse network traffic and it suitable for large-scale data. | Ctu-13 that have 13 different subset datasets | 91% accuracy |
| (Ding et al., 2018) | A malware detection method based on family behavior graph | -graph-based detection method using dependency (directed) graph.-dynamic taint analysis technique.-graph matching algorithm | System calls | This method was used to create a behavior graph of conduct for each group of malware. To discover a relationship between system calls, the method of dynamic taint analysis is used. | -six families of malware-benign samples collected randomly | 96.2% accuracy |
| (Li et al., 2018) | Modelling and clustering attacker activities in iot through machine learning techniques | Matrix with resort to graph-based clustering | Network traffic | This approach for modelling attacker activities based on the intuitive observations | Datasets from 10 honeypots in real-world environment which is 241,963 attacks. | Activity pattern identified |
| (Nikolopoulos & Polenakis, 2017) | A graph-based model for malware detection and classification using system-call groups | -dependency graphs (scd-graphs)-dynamic taint analysis | System call groups | This proposed method used to define similarity between two system call groups. | -2631 malware samples pre-classified into 48 families of malware.-testing on unknown sample file. | 94.70% accuracy |
| (Lee & Lee, 2014) | Gmad: graph-based malware activity detection by dns traffic analysis | -proposed dns behavior property: sequential correlation-dependency between two domain names | Dns traffic | This graph used the domain names as a directed node and sequential correlation as a relationship between two nodes. | -dns traffic captured from dns servers in large isp networks | 95.75% accuracy |
| (Nagaraja, 2014) | Botyacc: unified p2p botnet detection using behavioral analysis and graph analysis | -graph-based detection.-partitioning technique.-laplacian matrix | Network traffic | This method use to unify two well understood principles of botnet detection for p2p connectivity and traffic similarity. | Testbed of 25 servers within a test network connected to the internet | 98% accuracy |
| (Iliofotou et al., 2011) | Graption: a graph-based p2p traffic classification framework for the internet backbone | Graph-based classification methodTraffic dispersion graphs (tdgs)K-means | Network traffic(p2p traffic) | This approach use to classify traffic at the backbone | Three backbone traces from a tier-1 isp and the abilene (internet2) network. | 95% accuracy |
| (Park et al., 2010) | Fast malware classification by automated behavioral graph matching | -classification method based on maximal common subgraph detection.-a behavior graph | System call | The proposed method define similarity between two behavioral graphs. | -set of 300 malware instances in 6 families.-80 benign windows applications. | 59.45% accuracy |
| (Shang et al., 2010) | Detecting malware variants via function-call graph similarity | -function-call graph as signature-a novel algorithm | Dll | This method used to compute graph similarity between two program | Several malware families from vx heavens | 100% accuracy |
| (Camelo et al., 2010) | Condenser: a graph-based approach for detecting botnets | Graph-based approachClustering algorithm | Network traffic | Graph-based knowledge representation framework where the data have been stored | -top 10,000 domains from alexa for benign-10,000 dga domains provided by anubisnetworks as an anomalous dataset | 77.9%precision |
It can be concluded that the existing IoT botnet detection technique and method can be classified as graph, machine learning, anomaly and network based. After getting a positive result gained from metrics evaluation, the comparison approaches the requires to be performed for validate the effectiveness of the techniques. The comparison is concern into the accuracy and detection rate evaluation for the main criterion for the result validation. Therefore, this research will focus on to mitigate IoT botnet and represent in graph theory. This research proposed a novel graph theory based on graph method which is degree and valency. The method for mitigate IoT botnet attack are machine learning, anomaly and network based for static and dynamic analysis. This research will use all protocol such as DNS, TCP, UDP, HTTP and IP. The IoT botnet attack will focus on Hajime, Mirai and malicious malware. In order to bridge the gap, this research proposes a a novel graph theory model to detect and classify latest IoT botnets attacks
| Indicators | Baseline | Project activities related to indicator | Outputs and outcomes | Status |
|---|---|---|---|---|
| How do you measure project progress, linked to the your objectives and the information reported on the Implementation and Dissemination sections of this report. | Refers to the initial situation when the projects haven’t started yet, and the results and effects are not visible over the beneficiary population. | Refer to how the project has been advancing in achieving the indicator at the moment the report is presented. Please include dates. | We understand change is part of implementing a project. It is very important to document the decision making process behind changes that affect project implementation in relation with the proposal that was originally approved. | Indicate the dates when the activity was started. Is the activity ongoing or has been completed? If it has been completed add the completion dates. |
| Types of IoT Botnets Malware |
Initial number of malware = 0
The sample of malware need to be tested within a month to show the validation reaction between malware and environment.
Do the flow analysis to datasets of malware that has been captured and labelled. Then, every dataset has been analysed by illustrate the behaviour attack pattern through graph theory scheme.
Study the whole behaviour of each dataset by analyse the whole process in Windows platform.
Size of datasets
Initial size of datasets = 0Gb
The size of the dataset is too big for the Cuckoo Sandbox to be processed and generated.
Do the chunking process for every dataset to be loaded and processed by Cuckoo Sandbox.
Three of sample malware has been labelled as three datasets captured between January to April 2019. The dataset has their own characteristic by luring the behaviour attack pattern.
Gender Equality and Inclusion
IoT botnets attack does not focusing on specific target since IoT environment does require constant on network which the attack can spread all connected devices. Thus, the awareness of IoT botnets need to be gain for all gender if they are using IoT devices in their daily life. Men (66%) were slightly more likely than women (61%) to report having had security problems such as having an account compromised or hacked, or accidentally installing spyware, malware or a virus. Even so, women felt markedly less confident (52%) than men (33%) that they were protected from a range of security problems such as phishing, pharming, or having their bank, computer, or online accounts hacked. While women felt less secure, they were only marginally more likely (68%) than men (65%) to say they would like access to additional layers of online protection. An interesting difference between the ways men and women act to protect themselves online emerged in the survey. Women tend to rely more on personal means of protection than men. For example, it was noted earlier that women are more careful than men about the personal information they share online. Women (62%) were also more likely than men (49%) to make use of personalized privacy settings. After they experienced a security problem, women (61%) were more likely than men (51%) to make lasting changes in their online behavior in order to protect themselves from future problems.
Men, on the other hand, tend to rely marginally but consistently more on technical means of protection. Men tend to make greater use of VPNs (13% vs. 8% for women), email encryption programs (10% vs. 7%), IP masking sites (10% vs. 5%), password managers (20% vs. 17%), privacy enhancing browser plug-ins (18% vs. 13%) and two-factor authentication (15% vs. 12%). It may be that men are more confident than women that they are protected online because they tend to rely more heavily on technical means of protection. It may also be that men are more likely to be clueless when it comes to online security. The survey asked respondents whether they agreed with the statement “There’s no real danger in sharing personal information online”. It’s difficult to imagine that anyone who is even slightly familiar with the internet would agree with this statement. Nevertheless, 22% of men, compared to 15% of women, somewhat or completely agreed. In addition, while men were slightly more likely than women to report having experienced security problems, they were much more confident that they were protected online. There’s an obvious disconnect here. When you consider all of this in combination with the many ways that women are more careful about the information they share online, it’s hard to avoid the conclusion that women tend to be more sensible than men about protecting themselves on the internet.
Project Communication Strategy
This research will have a collaboration with Malaysian government sector, Cyber Security Malaysia (CSM) that can help the research further in several phases of research activities. Since the testbed environment may have a difficulties when gathering the data, CSM will help the research by lending various dataset that might helping the research even further. Project planning begins with the formation of a local project planning committee or group. Whenever possible, tribes and organizations should use a team approach to plan new projects which involves staff, community members, community or organizational leadership, and a grant writer or consultant if necessary. The committee members play an important role in keeping the project planning process on track while also ensuring everyone has the opportunity to participate. The committee can organize meetings, conduct surveys, gather and analyze information, and meet with other agencies and organizations. This team will develop the project plan and use it to write the different parts of the application. Generally, you want to spend approximately 80% of your time planning your project and 20% of your time writing and packaging the grant application. Once your team is in place, the planning process generally begins with an assessment of community problems and issues involving various methods to gather community input. Based on information gathered, project developers can identify problems and issues or interests common to all members of the community to begin the process of setting community priorities. Perhaps one of the most daunting aspects of project planning is ensuring community involvement, because it requires the knowledge and skills necessary to set up and conduct or facilitate effective planning sessions, large meetings, and presentations. Public meetings are essential to the development of a project with broad grassroots support. Meetings should be held regularly throughout the planning process. Properly facilitated meetings provide a great way to gather traditional, cultural, and local knowledge. They also serve as a means to receive input on goals, objectives, and activities in order to determine ways to best prioritize them.
Project planning involves a series of steps that determine how to achieve a particular community or organizational goal or set of related goals. This goal can be identified in a community plan or a strategic plan. Project plans can also be based on community goals or action strategies developed through community meetings and gatherings, tribal council or board meetings, or other planning processes. The planning process should occur before you write your application and submit it for funding.
Project planning:
- identifies specific community problems that stand in the way of meeting community goals.
- creates a work plan for addressing problems and attaining the goals.
- describes measurable beneficial impacts to the community that result from the project’s implementation.
- determines the level of resources or funding necessary to implement the project.
Communication is the process of transmitting ideas and information. For a grass roots initiative or community based organization, that means conveying the true nature of your organization, the issues it deals with, and its accomplishments to the community.
Communication can take many forms, including:
- Word of mouth
- News stories in both print and broadcast media
- Press releases and press conferences
- Posters, brochures, and fliers
- Outreach and presentations to other health and community service providers and to community groups and organizations
- Special events and open houses that your organization holds
To communicate effectively, it helps to plan out what you want from your communication, and what you need to do to get it.
- A plan will make it possible to target your communication accurately. It gives you a structure to determine whom you need to reach and how.
- A plan can be long-term, helping you map out how to raise your profile and refine your image in the community over time.
- A plan will make your communication efforts more efficient, effective, and lasting.
- A plan makes everything easier. If you spend some time planning at the beginning of an effort, you can save a great deal of time later on, because you know exactly what you should be doing at any point in the process.
The project team reached out to not specific groups by genders.
Recommendations and Use of Findings
The impact of graph theory is that it does not require a prior knowledge in mathematics. With the relation of graph theory can be visualized as node and vertices, researcher will have better understanding in terms of relationship between IoT botnets and its behavior. The connection of related information also helps represent the data visually and programmatically in future research. To implement a project means to carry out activities proposed in the application form with the aim to achieve project objectives and deliver results and outputs. Its success depends on many internal and external factors. Some of the most important ones are a very well organised project team and effective monitoring of project progress and related expenditures. Overall management has to be taken over by the lead partner and project manager, who is often employed or engaged by the lead partner. The project management has to have an efficient management system and always has to be flexible to current needs and changed situations, as the project is rarely implemented exactly according to the initial plan. Nevertheless, the partnership should aim to deliver quality results and outputs. Quality means meeting expectations described in the application and those agreed within the partnership. According to the lead partner principle, the overall responsibility for project monitoring will be with the lead partner. However, all partners should be responsible for monitoring their own part of the work. Non-performing or inactive partners can be a problem, especially in large partnership projects. This can cause delays or simply reduce the effectiveness of the project, especially if these partners fail to fulfil their obligations. The most effective solution is to create an atmosphere where all partners feel able to express dissatisfaction and internal problems. If problems continue, the lead partner may be forced to call on the programme or other external authorities, and may even exclude the partner as a last resort. While project partners are implementing the work plan, the programme co-financing the project is monitoring its implementation. Monitoring project progress is a main programme management tool. As an administrative procedure, the main task of monitoring is to assure that project inputs (budget and activities) and outputs are in line with the original plan (the application), and that the expenditure incurred complies with the rules of eligibility. The main feature of project monitoring is that it is based on the project application. For these reasons, it is important that monitoring is an on-going process and not a task left for the end of the project. Programmes put considerable emphasis on project monitoring, and it is one of the core tasks of those responsible for programme management. Monitoring of project implementation provides vital information on the overall performance of the programme; in particular, in terms of how (quantitatively and well as qualitatively) programme objectives and key targets have been met.
Other main reasons for monitoring are that it:
- Gives an accurate picture of the status of project implementation.
- Allows programmes to keep track of whether projects are being implemented according to the plan and thus keep track of all major project variables – cost, time, scope and quality of deliverables.
- Provides programme managers with important information on significant achievements which support programme information and publicity.
- Allows problem identification.
- Verifies and provides transparency on the spending of public funds.
Bibliography
Abdullah, R., & Abdollah, M. (2013). Revealing the Criterion on Botnet Detection Technique. IJCSI International Journal of Computer Science Issues, 10(2), 208–215.
Angrishi, K. (n.d.). Turning Internet of Things ( IoT ) into Internet of Vulnerabilities ( IoV ) : IoT Botnets, 1–17.
Antonakakis, M., April, T., Bailey, M., Bernhard, M., Arbor, A., Bursztein, E., … Zhou, Y. (2017). Understanding the Mirai Botnet This paper is included in the Proceedings of the Understanding the Mirai Botnet.
Aviv, A.J. and Haeberlen, A., 2011, August. Challenges in Experimenting with Botnet Detection Systems. In CSET.
B, A. K., & Lim, T. J. (2019). Early Detection of Mirai-Like IoT Bots in Large-Scale Networks through Sub-sampled Packet Traffic Analysis. Springer International Publishing. https://doi.org/10.1007/978-3-030-12385-7
Barford, P., & Kolaczyk, E. (2012). Intrusion as ( Anti ) social Communication : Characterization and Detection, 886–894.
Bhuiyan, M. Z. A., Wang, G., Wu, J., Cao, J., Liu, X., & Wang, T. (2017). Dependable Structural Health Monitoring Using Wireless Sensor Networks. IEEE Transactions on Dependable and Secure Computing, 14(4), 363–376. https://doi.org/10.1109/TDSC.2015.2469655
Bottazzi, G., & Me, G. (2014). The botnet revenue model. Proceedings of the 7th International Conference on Security of Information and Networks (SIN ’14), Glasgow, Scotland, UK, 459-465. New York, NY: Association for Computing Machinery (ACM). https://doi.org/10.1145/2659651.2659673
Bou-harb, E., Bou-harb, E., Debbabi, M., and Assi, C., 2016. Big Data Behavioral Analytics Meet Graph Theory : On Effective Botnet Takedowns Big Data Behavioral Analytics Meet Graph Theory : On Effective Botnet Takedowns, (August), pp.1–10.
Brewer, R. (2016). Ransomware attacks: detection, prevention and cure. Network Security, 2016(9), 5–9. https://doi.org/10.1016/S1353-4858(16)30086-1
Burhan, M., & Rehman, R. A. (2018). IoT Elements , Layered Architectures and Security Issues : A Comprehensive Survey, 1–37. https://doi.org/10.3390/s18092796
Camelo, P., Moura, J., & Krippahl, L. (2010). CONDENSER : A Graph-Based Approach for Detecting Botnets.
Chakkaravarthy, S. S., Sangeetha, D., & Vaidehi, V. (2019). A Survey on malware analysis and mitigation techniques. Computer Science Review, 32, 1–23. https://doi.org/S1574013718301114
Chen, C., & Lin, H. (2014). Detecting botnet by anomalous traffic *. Journal of Information Security and Applications, 21, 42–51. https://doi.org/10.1016/j.jisa.2014.05.002
Chowdhury, S., Khanzadeh, M., Akula, R., Zhang, F., Zhang, S., Medal, H., … Bian, L. (2017). Botnet detection using graph-based feature clustering. Journal of Big Data, 4(1). https://doi.org/10.1186/s40537-017-0074-7
Cid-fuentes, J. Á., Szabo, C., & Falkner, K. (2018). An adaptive framework for the detection of novel botnets, 79, 148–161. https://doi.org/10.1016/j.cose.2018.07.019
Cohen, A., & Nissim, N. (2018). Trusted detection of ransomware in a private cloud using machine learning methods leveraging meta-features from volatile memory. Expert Systems with Applications, 102, 158–178. https://doi.org/10.1016/j.eswa.2018.02.039
Constantinos Kolias, Georgios Kambourakis, Angelos Stavrou, & Jeffrey Voas. (2017). DDoS in the IoT: Mirai and Other Botnets. Computer, 79. https://doi.org/10.1109/MC.2017.201
da Costa, K. A. P., Papa, J. P., Lisboa, C. O., Munoz, R., & de Albuquerque, V. H. C. (2019). Internet of Things: A survey on machine learning-based intrusion detection approaches. Computer Networks, 151, 147–157. https://doi.org/10.1016/j.comnet.2019.01.023
Darwish, D. G. (2015). Improved Layered Architecture for Internet of Things, 4(4), 214–223.
Daya, A. A., Salahuddin, M. A., Limam, N., & Boutaba, R. (2019). A Graph-Based Machine Learning Approach for Bot Detection, (April).
Ding, Y., Xia, X., Chen, S., & Li, Y. (2018). A malware detection method based on family behavior graph. Computers and Security, 73, 73–86. https://doi.org/10.1016/j.cose.2017.10.007
Dorsemaine, B., Gaulier, J., & Urien, P. (2015). Internet of Things : a definition & taxonomy. https://doi.org/10.1109/NGMAST.2015.71
Eberle, W., & Holder, L. (2007). Discovering Structural Anomalies in Graph-Based Data, 393–398. https://doi.org/10.1109/ICDMW.2007.91
Edwards, S., & Profetis, I. (2016). Hajime : Analysis of a decentralized internet worm for IoT devices. https://doi.org/10.1109/PIMRC.2011.6139943
Elovici, Y., Shabtai, A., Breitenbacher, D., Bohadana, M., Mathov, Y., Meidan, Y., & Mirsky, Y. (2018). N-BaIoT—Network-Based Detection of IoT Botnet Attacks Using Deep Autoencoders. IEEE Pervasive Computing, 17(3), 12–22. https://doi.org/10.1109/mprv.2018.03367731
European Union Agency for Network and Information Security (ENISA). (2019). ENISA threat landscape report 2018: 15 top cyber-threats and trends. Heraklion: ENISA. https://doi.org/10.2824/622757
Foote, K. D. (2016). A Brief History of the Internet of Things.
Ganguli, S., & Friedman, T. (2017). IoT technology disruptions: A Gartner trend insight report (Report ID G00331334). Stamford, CT:Gartner.https://www.gartner.com/en/doc/3738060-iot-technologydisruptions
Ghafir, I., Prenosil, V., & Hammoudeh, M. (2016). Botnet Command and Control Traffic Detection Challenges : A Correlation-based Solution, 1–5.
Gu, G., Perdisci, R., Zhang, J., & Lee, W. (2015). BotMiner : Clustering Analysis of Network Traffic for Protocol- and Structure-Independent Botnet Detection, 139–154.
Gurr, J. J. (2018). DECEPTIVE MACHINE LEARNING FOR OFFENSE AND DEFENSE TARGETING FINANCIAL.
Hughes, K. and Qu, Y., 2012. A theoretical model: Using logistic regression for malware signature based detection. In The 10th International Conference on Dependable, Autonomic, and Secure Computing (DASC-2012).
Ijaz, M., Durad, M. H., & Ismail, M. (2019). Static and Dynamic Malware Analysis Using Machine Learning. Proceedings of 2019 16th International Bhurban Conference on Applied Sciences and Technology, IBCAST 2019, (May), 687–691. https://doi.org/10.1109/IBCAST.2019.8667136
Ilascu, I. (2018). New Iot Botnet Torii Uses Six Methods for Persistence, Has No Clear Purpose.
Iliofotou, M., Kim, H., Faloutsos, M., Mitzenmacher, M., Pappu, P., & Varghese, G. (2011). Graption : A graph-based P2P traffic classification framework for the internet backbone. Computer Networks, 55(8), 1909–1920. https://doi.org/10.1016/j.comnet.2011.01.020
Internet Society. (2015). Policy brief: Botnets. Reston, VA: Internet Society.
Kaur, Tejvir Malhotra, Vimmi Singh, D. (2014). Comparison of network security tools-Firewall, Intrusion Detection System and Honeypot. International Journal of Enhanced Research in Science Technology & Engineering, 3(2), 200–204.
Khan, R., Khan, S. U., Zaheer, R., & Khan, S. (2012). Future Internet : The Internet of Things Architecture , Possible Applications and Key Challenges. https://doi.org/10.1109/FIT.2012.53
Kim, W., Jeong, O.-R., Kim, C., & So, J. (2010). On botnets. Proceedings of the 12th International Conference on Information Integration and Web-Based Applications & Services – IiWAS ’10, (2), 5. https://doi.org/10.1145/1967486.1967488
Kong, S., Application, F., & Data, P. (2011). ( 12 ) United States Patent, 2(12), 12–15. https://doi.org/10.1016/j.(73)
Lab, K. (2017). Skilled Attacker Develops Advanced Windows Botnet to Spread Infamous Mirai Malware. Retrieved from https://www.kaspersky.com/about/press-releases/2017_skilled-attacker-develops-advanced-windows-botnet-to-spread-infamous-mirai-malware
Lab, K. (2018). New IoT-malware grew three-fold in H1 2018.
Lawrence, A. (2018). Dramatic Increase of DDoS Attack Sizes Attributed to IoT Devices.
Lee, J., & Lee, H. (2014). GMAD: Graph-based malware activity detection by DNS traffic analysis. Computer Communications, 49, 33–47. https://doi.org/10.1016/j.comcom.2014.04.013
Li, J., Li, B., Wang, L., Sun, P., & Alam Bhuiyan, M. Z. (2018). Modeling and clustering attacker activities in IoT through machine learning techniques. Information Sciences, 479, 456–471. https://doi.org/10.1016/j.ins.2018.04.065
Madakam, S., Ramaswamy, R., & Tripathi, S. (2015). Internet of Things ( IoT ): A Literature Review, (May), 164–173.
Mayer, A., Wool, A., & Ziskind, E. (2000). Fang: A firewall analysis engine. Proceedings of the IEEE Computer Society Symposium on Research in Security and Privacy, 177–187. https://doi.org/10.1109/SECPRI.2000.848455
Morgan, T. D. (2008). Recovering deleted data from the Windows registry. Digital Investigation, 5(SUPPL.). https://doi.org/10.1016/j.diin.2008.05.002
Musil, S. (2012). Zeus botnet steals $47M from European bank customers.
MYCERT. (2018). Reported Incidents based on General Incident Classification Statistics 2018. Reported Incidents bas ed on General Incident C las s ification Statis tics 2 018. Retrieved from https://www.mycert.org.my/assets/graph/pdf/2014-1.pdf
MYCERT. (2019). Reported Incidents based on General Incident Classification Statistics 2018. Reported Incidents bas ed on General Incident C las s ification Statis tics 2 019. Retrieved from https://www.mycert.org.my/assets/graph/pdf/2014-1.pdf
Nagaraja, S. (2014). Botyacc : Unified P2P Botnet Detection Using Behavioural Analysis and Graph Analysis, 439–456.
Nguyen, H. (2018). IoT Botnet Detection Approach Based on PSI graph and DGCNN classifier. 2018 IEEE International Conference on Information Communication and Signal Processing (ICICSP), (Icsp), 118–122.
Nikolopoulos, S. D., & Polenakis, I. (2017). A graph-based model for malware detection and classification using system-call groups. Journal of Computer Virology and Hacking Techniques, 13(1), 29–46. https://doi.org/10.1007/s11416-016-0267-1
Park, Y., Reeves, D., Mulukutla, V., & Sundaravel, B. (2010). Fast malware classification by automated behavioral graph matching, 1. https://doi.org/10.1145/1852666.1852716
Pathak, P. B. (2016). A Dangerous Trend of Cybercrime: Ransomware Growing Challenge. International Journal of Advanced Research in Computer Engineering & Technology, 5(2), 371–373.
Patil, S. P. (2011). Botnet-A Network Threat, 28–35.
Pelino, 2016. The Internet of Things Heat Map, 2016: Where IoT will have the Biggest Impact on Digital Business, Forrester News.
Qing, S., & Wen, W. (2005). A survey and trends on Internet worms. Computers and Security, 24(4), 334–346. https://doi.org/10.1016/j.cose.2004.10.001
Rajesh, B., Reddy, Y. R. J., & Reddy, B. D. K. (2015). A Survey Paper on Malicious Computer Worms. International Journal of Advanced Research in Computer Science & Technology, 3(2), 161–167.
Rolia, J., Zhu, X., & Arlitt, M. (2003). Resource Access Management for a utility hosting enterprise applications. IFIP Advances in Information and Communication Technology, 118, 549–562. https://doi.org/10.1007/978-0-387-35674-7
Roy Mark. (2005). Oregon Man Cops Plea in eBay DDOS Attack.
Sahrom, B., & Roziah, S. (2017). Mirai Botnet Infection in Malaysia : Impact and Countermeasures, (September), 2016–2018.
Science, E. (2017). A Comparative Study on the Architecture Internet of Things and its ’ Implementation method A Comparative Study on the Architecture Internet of Things and its ’ Implementation method.
Seenivasan, D., & Shanthi, K. (2014). Categories of Botnet : A Survey, 8(9), 1689–1692.
Shang, S., Zheng, N., Xu, J., Xu, M., & Zhang, H. (2010). Detecting malware Variants via Function-call Graph Similarity, 113–120.
Silva, S. S. C., Silva, R. M. P., Pinto, R. C. G., & Salles, R. M. (2013). Botnets: A survey. Computer Networks, 57(2), 378–403. https://doi.org/10.1016/j.comnet.2012.07.021
Smith, C., Matrawy, A., Chow, S., & Abdelaziz, B. (2009). Computer Worms: Architectures, Evasion Strategies, and Detection Mechanisms. Journal of Information Assurance and Security, 4, 69–83.
Statista. (2019). Internet of Things (IoT) connected devices installed base worldwide from 2015 to 2025 (in billions).
Stamford, 2015. Gartner Says 6.4 Billion Connected “Things” Will be Use in 2016, Up 30 Percent From 2015, Press Release Newsroom.
Symantec, 2015. Mirai: what you need to know about the botnet behind recent major DdoS attacks, https://www.symantec.com/connect/blogs/mirai-what-you-need-know-about-botnet-behind-recent-major-ddos-attacks, Symantec Official Blog.
Vania, J., Meniya, A., & Jethva, H. B. (2013). A Review on Botnet and Detection Technique. International Journal of Computer Trends and Technology, 4, 4–1. Retrieved from http://www.internationaljournalssrg.org
Vankeerberghen, P., den Bogaert, B. Van, & Massart, D. L. (1996). Dynamic link libraries I. Introduction. TrAC Trends in Analytical Chemistry, 15(6), 206–208. https://doi.org/https://doi.org/10.1016/0165-9936(96)00026-X
Wash, R. (2007). Incentive design for home computer security. CHI ’07 Extended Abstracts on Human Factors in Computing Systems – CHI ’07, 1681. https://doi.org/10.1145/1240866.1240882
Web, D. (2017). Doctor Web detects Trojan for Windows that infects Linux devices. Retrieved from https://news.drweb.com/show/?i=11140&lng=en
Worm strikes down Windows 2000 systems. (2005).
Yang, C. H., & Ting, K. L. (2009). Fast deployment of botnet detection with traffic monitoring. IIH-MSP 2009 – 2009 5th International Conference on Intelligent Information Hiding and Multimedia Signal Processing, 856–860. https://doi.org/10.1109/IIH-MSP.2009.303
This work is licensed under a Creative Commons Attribution-ShareAlike 4.0 International License 

