TECHNICAL REPORT
| Grantee |
TeleMARS Pty Ltd
|
| Project Title | Experiment and improve reinforcement learning algorithms to enhance anomalous network behaviour detection |
| Amount Awarded | US$30,000.0 |
| Dates covered by this report: | 2020-10-01 to 2020-10-01 |
| Report submission date | 2021-06-23 |
| Economies where project was implemented | Australia |
| Project leader name |
Chen Lin
|
| Project Team |
Denis O'Sullivan
[email protected]
Jing Yang
[email protected]
|
Project Summary
Cybersecurity is a significant research area because all of the operations based on government, military, commercial, financial and civilians gather, process, transfer and store tremendous volume of data on computers and others. Cyber-attacks have imposed increasing threats and damages on our modern society at all levels. Network Intrusion Detection System (NIDS) is one of the major techniques in preventing cyber-attacks occurred in network traffic. Over the past decade, a lot of research work has been conducted to explore the capabilities of artificial intelligence (AI) methods in developing NIDS solutions. The previous studies suggested that AI algorithms have promising potentials in developing effective solutions to detect the increasing attacks. TeleMARS R&D team commits to advance AI-based methods, explore realistic approaches of deploying the research outcomes in real network environment, and support on-going research in wider community to achieve long term sustainable development. The key objectives of this project are to contribute to the development of NIDS; contribute to research community in the subject of anomaly detection; establish a practical collaboration framework to enable scientists and IT professionals from diverse background to work together to continuously contribute to NIDS research; test and prove TeleMARS operation and technical frameworks, and the team capabilities; and inspire and enable the participation of broader research community in cybersecurity domain supporting gender equality and inclusion. This project was commenced in September 2020 and finalised in June 2021. The main activities included: Literature review and project design. Data analysis and preparation. Anomaly detection model development using Machine Learning methods including Reinforcement Learning method. Model experimentation. Established evaluation pipelines to simulate real application environment. Model capability evaluation applying different datasets. Implementation of a collaboration framework supporting the research activities conducted by researchers and professionals with various backgrounds.
Table of contents
- Project factsheet information
- Background and justification
- Project Implementation
- Project Evaluation
- Gender Equality and Inclusion
- Project Communication Strategy
- Recommendations and Use of Findings
- Bibliography
Background and Justification
Motivation
While network technologies and applications have grown rapidly, cybersecurity has taken a critical role in the daily operations of government, business and community. Cyber-attacks are becoming more sophisticated and thereby presenting increasing challenges in cybersecurity. Failure in defending cyber-attacks could compromise system’s confidentiality, availability and integrity. In recent time, AI-based anomaly detection methodologies have attracted great attentions in research aiming to tackle the attack detection problems.
TeleMARS focuses on the research and development of artificial intelligent (AI) solutions. The team of TeleMARS has established strong experience over past 15 years in the industry applications that apply artificial intelligent methods to address business problems. We understand the gaps between research and industry applications, and understand how to integrate research efforts into practical solutions that realise benefits. Facing the problems imposed by ever-growing cyber-attacks, TeleMARS is motivated to contribute its experience of AI to finding a practical solution of NIDS to defend network attacks.
This project commits to contribute to the improvements of AI-based anomaly detection methods and models to overcome the challenges the research community is encountering.
Challenges
Subject matter experts in networking infrastructure and network traffic have been working on identifying major categories of active network-attacks. According to the Australian Cyber Security Centre (ACSC) cyber threat reports and McAfee Labs threats reports, the major types of active network-attacks include the following [2]
- Denial of Service (DoS), which is an attempt by an attacker to prevent legitimate access to websites by overwhelming the amount of available bandwidth or resources of the computer system.
- Brute Force, which endeavours to illegally obtain pairs of user names and passwords by trying all predefined pairs to gain access to network services, with automated applications often used to guess password combinations.
- Browser-based network attacks, which attempt to penetrate anonymous communication systems by exploiting JavaScript and HTML, such as Cross-site Scripting (XSS), to create some predefined rules for correlating user activities based on the websites visited.
- Shellshock attacks, which relate to vulnerabilities that breach the command-line shell of Linux, UNIX and Apple OS systems called Bash.
- SSL attack, which aims to intercept encrypted data, send them over a network and then access the unencrypted data and benefit by gaining access to applications.
- Backdoor attack, which can be defined as a technique which exposes computers to remote access by naturally replying to particularly constructed client applications.
- Botnet, which denotes the number of hijacked computer systems remotely operated by one or many malicious actors which coordinate their activities by Command and Control (C&C).
A number of mainstream public datasets were produced describing both benign and abnormal network traffic behaviours. Feature selection approaches have been applied in building these datasets in order to represent network attacks more accurately and more complete to support the development of data driven solutions. In recent datasets, the zero-day attacks are captured to construct more comprehensive profile.
Provided with the constructed datasets, numerous AI-based methods including machine learning models have been studied in building NIDS applications in the last decade.
The results of the studies published in recent literature have shown great potentials in machine learning models, as well as some limitations. The main challenges in NIDS using machine learning approaches are outlined below: [1]
Dataset: It is challenging in producing datasets that contains comprehensive and up-to-date malicious attacks with correct labels. Creating new NIDS datasets demand designing realistic environments that include broad diversity of normal and attack scenarios.
Emerging attacks: Most AI and machine learning methods in general perform poorly when there are changes in the feature space within which learning occurs. The models trained without emerging attacks do not detect them well.
Real-time detection: Real-time detection has many challenges for several reasons. Firstly, the features created for network traffic may contain a set of noisy or irrelevant ones. Secondly, the lightweight of detection methods needs to be carefully adopted to ensure the healthy processing time and resource balance. [8]
TeleMARS R&D team is motivated to tackle the challenges of emerging attacks and real-time detection.
Project Implementation
Overview
The expected research outcomes of this project include:
- the understanding in the capabilities of Reinforcement Learning method in cyber-attack detection;
- comparisons of the performance of a number of popular machine learning (ML) models;
- an evaluation method and platform that can be deployed in real network environment;
- comparison of the robustness of various ML models when feature space changes; and
- a collaboration framework that supports researchers and professionals from various backgrounds.
The in-scope research work involved the following components to achieve the objectives.
- Selection of datasets and the ML models that show strong anomaly detection capability.
- Design and develop various machine learning models using traditional machine learning experiment approach, including
- Shallow Learning classification-based models;
- Neural Network Deep Learning models; and
- A novel Reinforcement Learning model.
- Experiment a novel evaluation method on the trained models.
- Experiment the evaluation of the trained model applying a separate dataset which has different feature space from the training data.
A comprehensive literature review was conducted to refine the project designs including research dataset selection, which is detailed in Project Implementation Phase I section. Data analysis was conducted to refine the selection and the designs of learning algorithms.
This project selected two public datasets which were collected by different approaches and constructed with different feature spaces. Based on the data analysis and literature review, a number of Shallow Learning and Neural Network Deep Learning methods that were studied in previous research were selected to conduct the comparison against a Reinforcement Learning method.
The models were designed using the selected methods including Reinforcement Learning method, and experimented against the selected datasets. The performance of the models was measured against a set of metrics to conduct comparison and analysis of their capabilities in developing NIDS applications.
Future research in real-time detection requires an effective evaluation approach to measure the overall performance within an environment that simulates real network traffic. The scope of this project does not include real network traffic data collection and construction. An evaluation method was designed to simulate the detection process in real environment and test the consistency and stability of the trained models.
Meanwhile, this project established a collaboration framework providing supportive teamwork environment to support the joint research effort. The collaboration framework aims to enable broader research and IT communities to collaborate and contribute to the on-going research venture in the domain of NIDS applications.
The research activities are carried out in three phases to deliver the above components.
Phase I Selection of Datasets and Reference Models
Literature review has been conducted to analyse the previous studies in the field of cyber-attack detection to understand the problems, the approaches studied, the outcomes, the potentials and the challenges.
The basic NIDS components are demonstrated in the following diagram.

Figure 1 NIDS key components
Data collection provides the source data of network traffic for detection model development and implementation. Creating or collecting effective datasets is challenging as it demands designing realistic environments that include wide diversity of normal and attack scenarios, and constructing a comprehensive profile that involves all possible legitimate behaviours.
Real network traffic data collection and processing is excluded in the scope of this project. The public datasets that were produced by networking experts are adopted to support this research work.
Dataset Selection
The available public datasets can be classified as network traffic, electrical network-based, android app-based, internet application-based, and IoT-based.
The table below shows a list of available public datasets. [4]
| Public dataset | Year of publish | Number of times cited by June 2019 |
| DARPA 1998 | 1998 | 1069 |
| KDD Cup 1999 | 1999 | N/A |
| NSL-KDD | 2009 | 1630 |
| UNSW-NB15 | 2015 | 202 |
| DEFCON | 2000 | 12 |
| CAIDAs | 2017 | 18 |
| CDX | 2013 | 8 |
| TWENTE | 2014 | 222 |
| CIC DoS | 2017 | 18 |
| CIC-IDS2017 | 2017 | 87 |
| CSE-CIC-IDS2018 | 2018 | N/A |
| ISCX | 2012 | 453 |
| ADFA2013 | 2013 | 147 |
| LBNL | 2016 | 7 |
| ICS cyber attack | 2015 | 124 |
| IEEE 300-bus power test system | N/A | 171 |
| Tor-nonTor | 2017 | 18 |
| URL | 2016 | 7 |
| MAWI | 2011 | 182 |
| VPN-nonVPN | 2016 | 49 |
| Android validation | 2014 | 33 |
| Android malware | 2018 | 1 |
| Bot-IoT | 2018 | 2 |
| CTU-13 | 2013 | 244 |
| ISOT | 2008 | 98 |
| SSHCure | 2014 | 37 |
Table 1 Available public dataset
Analysis was conducted on these datasets applying the following criteria:
- Network traffic data including those at router and link .
- Completeness of network traffic profile including both benign and abnormal behaviours.
- Number of times cited.
- Methods of data collection and preparation.
NSL-KDD and CIC-IDS2017 datasets were selected to conduct machine learning model designs and experiments.
KDD CUP 1999 is considered benchmark data for assessment of intrusion detection systems. The data includes four main categories of attacks that are Denial-of-Service (DoS), user-to-root (U2R), Remote to Local Attack (R2L) and Probing Attack. Also, there are three content features and thirty-eight numerical features in the dataset. The features consist of basic features of individual TCP connections, content features within a connection suggested by domain knowledge and traffic features computed using a two-second time window. The NSL-KDD dataset is recommended to solve some of the inherent problems of the KDD’99 dataset. Compared to the original KDD dataset, the NSL-KDD dataset has the following improvements: (1) it does not include redundant records, (2) it does not include duplicate records, (3) the number of selected records is organized as the percentage of records, and (4) the number of records is reasonable.
As NSL-KDD has been heavily used in the studies of machine learning methods, it is used in this project for a benchmark comparison.
The Canadian Institute for Cybersecurity (CIC) conducted a number of projects aiming to overcome the shortcomings of previous datasets, aiming to develop a systematic approach to generate diverse and comprehensive benchmark dataset for intrusion detection based on the creation of user profiles which contain abstract representations of events and behaviours seen on the network. Generating realistic background traffic was the top priority in building this dataset. CIC has used the proposed B-Profile system to profile the abstract behaviour of human interactions and generates naturalistic benign background traffic. For this dataset, the abstract behaviour of 25 users based on the HTTP, HTTPS, FTP, SSH, and email protocols were built. CIC-IDS2017 dataset comprises both benign behaviour and also details of new malware attacks: such as Brute Force FTP, Brute Force SSH, DoS, Heartbleed, Web Attack, Infiltration, Botnet and DDoS. This dataset is labelled based on the timestamp, source and destination IPs, source and destination ports, protocols and attacks. A complete network topology was configured to collect this dataset which contains Modem, Firewall, Switches, Routers, and nodes with different operating systems (Microsoft Windows (like Windows 10, Windows 8, Windows 7, and Windows XP), Apple’s macOS iOS, and open-source operating system Linux).
The CICFlowMeter tool is used to extract 80 network flow features from the generated network traffic. The flows are tagged using the timestamp, the source and destination ports and IP addresses, and protocol types.
It reproduced comprehensive network traffic conditions and categories of data at both router and application level, providing relatively comprehensive network traffic profile for model training. It has been cited 87 times in recent research work. By using this dataset, this research work could contribute to the research community by adding meaningful reference data and/or lessons for any subsequent research work.
Proposed AI Approaches and Models
There are two major IDS approach classes for building attack detection model: Signature IDS approach and Anomaly IDS approach.
A Signature IDS monitors network traffic to match observed behaviours with attack signatures logged in a database. It produces higher detection rates and lower false alarm rates for known attacks than other types, but it cannot detect new or even variants of known attacks. This is a significant issue in terms of the computer security required to defend against those attacks. Moreover, a huge effort is necessary to repeatedly update its database that includes various rules for malicious activities, established by network security experts. To address the drawbacks of signature IDS, anomaly IDS approaches have been heavily studied. An Anomaly IDS creates a normal profile and identifies any variations from it as a suspicious event. It can identify known and zero-day attacks with less effort to construct its profile than a Signature IDS. Figure 2 summaries the major categories of anomaly detection approaches. [2]
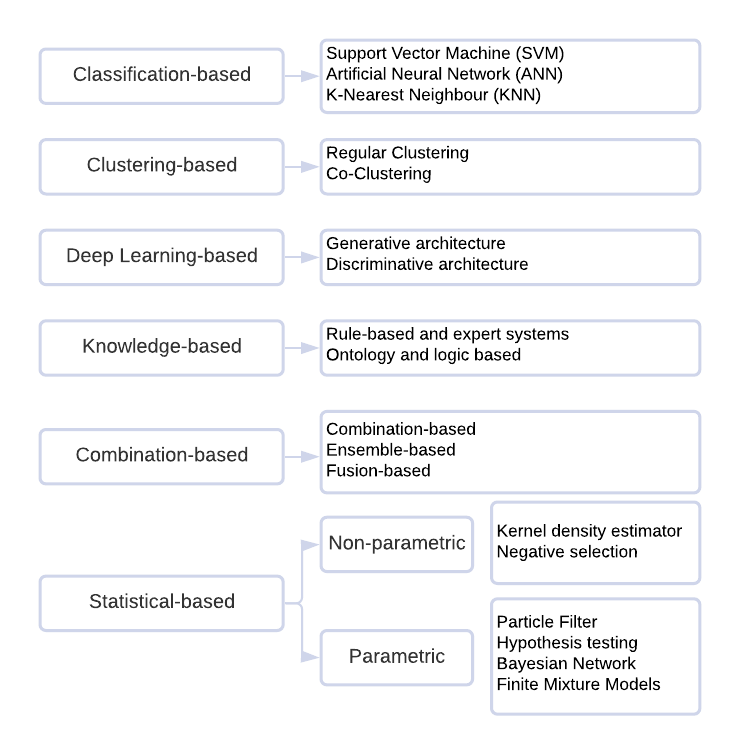
Figure 2 Anomaly detection approach categories
Among these categories, both the classification-based shallow learning and deep learning methods have shown promising results using existing public datasets. Based on the data analysis outcomes, the following methods were selected to produce performance reference and comparison: Random Forest (RF), Support Vector Machine (SVM), K Nearest Neighbour (KNN), Multi-Layer Perceptron Neural Network (MLP-NN), Long Short-Term Memory Convolutional Neural Network (LSTM-CNN).
In recent literature, Reinforcement Learning method has been proposed in a few studies to explore how it can improve the capability of deep neural network [8]. This project designed and experimented an Adversarial Reinforcement Learning (ARL) model to explore its ability in detecting emerging attacks.
Phase II Design and experiment various machine learning models
Experiment Environment:
The experiments were carried out in a cloud-based environment. Azure pipeline was used to setup DevOp environment. The bidirectional traceability is established across requirements, stories, repositories, test cases and test results. The environment allows multiple users to access the resources and conduct development collaboratively. DataOps pipelines were setup to apply various source data ingestion to the process of model training and validation. Researchers can choose suitable DataOps pipeline for each experimentation. The conceptual model of the environment components is demonstrated in the diagram below.
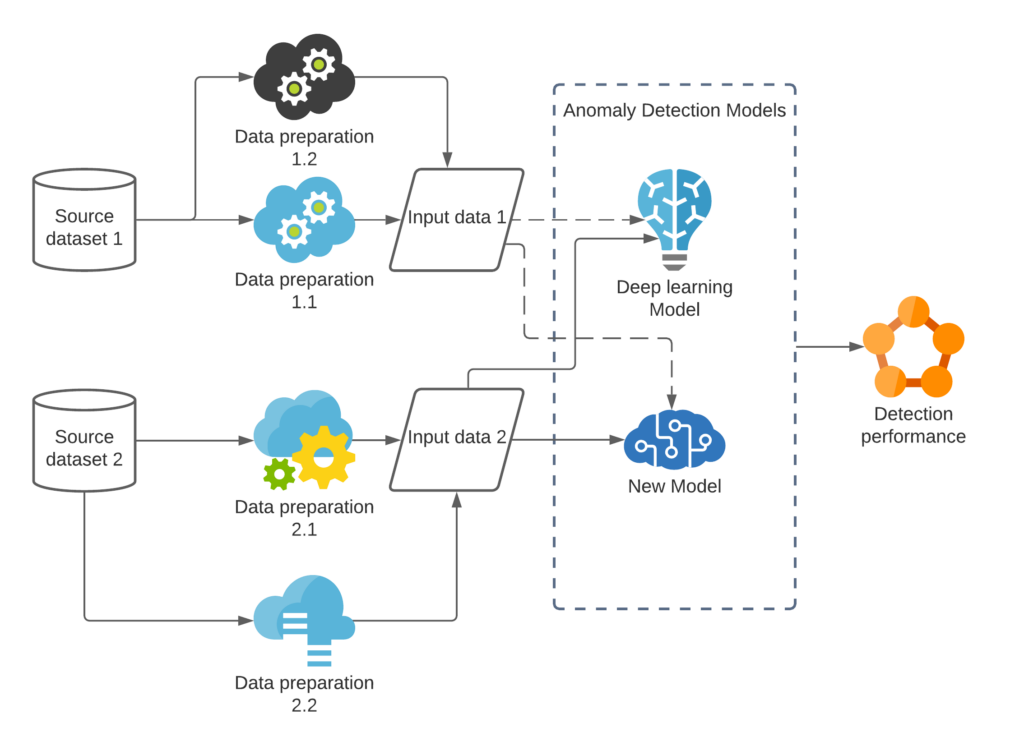
Figure 3 Experiment environment
Experiment Processes
The experiments were carried out through the following steps.
- Prepared the selected datasets NSL-KDD and CICIDS2017 respectively.
- Designed the machine learning models applying the selected methods and the respective dataset.
- Conducted model training and experiments using the prepared data.
- Designed an Adversarial Reinforcement Learning (ARL) model structure for CIC-IDS2017 dataset.
- Conducted ARL model training and experiments using the prepared CIC-IDS2017 data.
- Analysed the anomaly detection and category classification results.
A typical machine learning model development and experiment process is demonstrated in the diagram below. This project applies the same process to conduct the work.
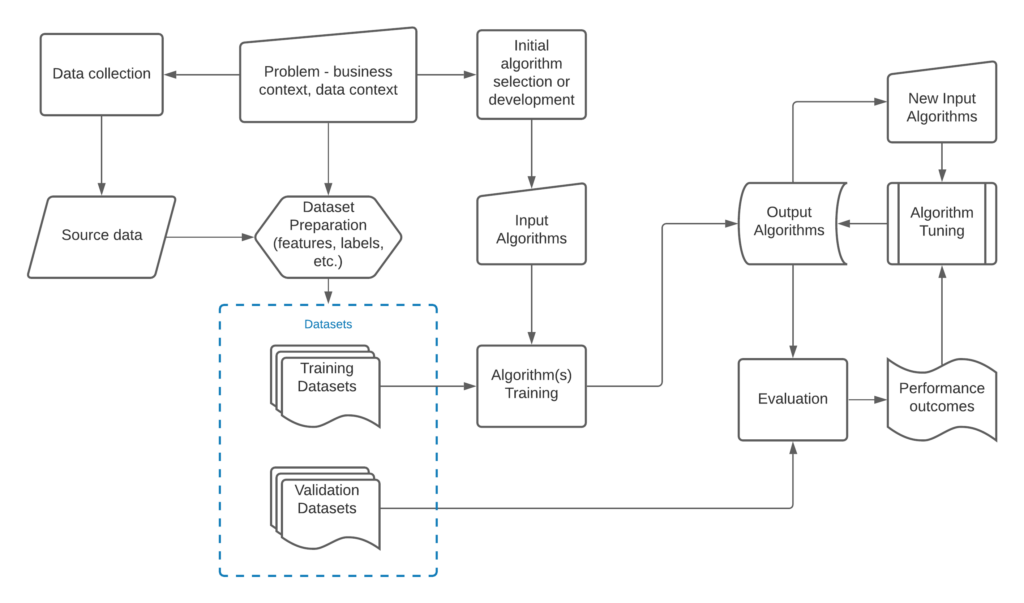
Figure 4 Model training and experiment process
Dataset Analysis and Preparation
Data preparation is a significant step for machine learning methods. The network data extracted from network traffic includes noisy or irrelevant information, missing or duplicated data values, which impact the performance of detection model for detecting anomaly. In order to design and architect the models, the datasets were carefully analysed so that the characters, the feature structures, and the distribution shapes were understood. Suitable data cleansing and processing operations were designed and conducted on the selected datasets respectively.
NSL-KDD Dataset
Data availability
NSL-KDD, which is an updated version of KDD’99 dataset, is downloaded from https://www.unb.ca/cic/datasets/nsl.html. 8 files are available in the dataset:
- KDDTrain+.ARFF: The full NSL-KDD train set with binary labels in ARFF format
- KDDTrain+.TXT: The full NSL-KDD train set including attack-type labels and difficulty level in CSV format
- KDDTrain+_20Percent.ARFF: A 20% subset of the KDDTrain+.arff file
- KDDTrain+_20Percent.TXT: A 20% subset of the KDDTrain+.txt file
- KDDTest+.ARFF: The full NSL-KDD test set with binary labels in ARFF format
- KDDTest+.TXT: The full NSL-KDD test set including attack-type labels and difficulty level in CSV format
- KDDTest-21.ARFF: A subset of the KDDTest+.arff file which does not include records with difficulty level of 21 out of 21
- KDDTest-21.TXT: A subset of the KDDTest+.txt file which does not include records with difficulty level of 21 out of 21
ARFF-formatted files include ‘attribute’ in their header, which are description of columns in the dataset. In this analysis, KDDTrain+.ARFF and KDDTest+.ARFF files are used as training and testing data, respectively.
Data description
There are 125,973 training records in the training data and 22,544 testing records in the testing data. In each dataset, there are 42 columns, where the last column represents labels (‘normal’/’anomaly’) for the records. 41 attributes were recorded and their descriptions are listed in Appendix 1. List of all attributes included in NSL-KDD data.
In training data, 67,343 records are labelled ‘normal’ and 58,630 records are ‘anomaly’, which shows it’s a well-balanced dataset. In testing data, there are 12,833 ‘normal’ records and 9,711 ‘anomaly’ records.
Data Preparation
- Encoding categorical data: Three columns: ‘protocol_type’, ‘service’ and ‘flag’ are categorical data with more than 2 categories in each column. These categories are encoded by One Hot Encoding from Python in training data and testing data, respectively. Due to the fact that fewer categories are available in testing data for ‘service’ data, columns associated with these 6 missing categories are set to 0 in the testing data. Associated original columns are then removed and replaced by these dummy columns.
- Normalisation: Histograms of columns with numeric data are illustrated in Figure 5, where it is clear that majority data in these columns are 0. In order to minimize the effect of absolute values to classification model, training data are normalized to standardized data with mean 0 and standard deviation 1. Testing data are normalized based on mean and standard deviation values estimated from original training data.

Figure 5 Histogram of numeric columns in NSL-KDD training dataset
CICIDS2017 Dataset
Data availability and description
CICIDS 2017 data consists of 8 data files collected from Monday to Friday in a week. In summary, 14 categories are included in the data, which are
- BENIGN: 2,830,743 records,
- FTP-Patator: 7,938 records
- SSH-Patator: 5,897 records
- DoS Hulk: 231,073 records
- DoS GoldenEye 10,293 records
- DoS slowloris: 5,796 records
- DoS Slowhttptest: 5,499 records
- Heartbleed: 11 records
- Web Attack Brute Force: 1,507 records
- Web Attack XSS: 652 records
- Web Attack Sql Injection: 21 records
- Infiltration: 36 records
- Bot: 1,966 records
- PortScan: 158,930 records
- DdoS: 128,027 records
Details of the distributions of these records in each file are listed in the Table 2 below.
| File Name | Category | Number of Records |
| Monday-WorkingHours.pcap_ISCX.csv | Benign | 529918 |
| Tuesday-WorkingHours.pcap_ISCX.csv | Benign FTP-Patator SSH-Patator | 432074 7938 5897 |
| Wednesday-WorkingHours.pcap_ISCX.csv | Benign DoS Hulk DoS GoldenEye DoS slowloris DoS Slowhttptest Heartbleed | 440031 231073 10293 5796 5499 11 |
| Thursday-WorkingHours-Morning-WebAttacks.pcap_ISCX.csv | Benign Web Attack Brute Force Web Attack XSS Web Attack Sql Injection | 168186 1507 652 21 |
| Thursday-WorkingHours-Afternoon-Infilteration.pcap_ISCX.csv | Benign Infiltration | 288566 36 |
| Friday-WorkingHours-Morning.pcap_ISCX.csv | Benign Bot | 189067 1966 |
| Friday-WorkingHours-Afternoon-PortScan.pcap_ISCX.csv | PortScan Benign | 158930 127537 |
| Friday-WorkingHours-Afternoon-DDos.pcap_ISCX.csv | DDoS Benign | 128027 97718 |
Table 2 CICIDS2017 data profile
Data preparation
1. Sub dataset selection
The full CICIDS2017 dataset is very large in size which makes practical model training and testing very difficult. In this work, we applied stratified random sampling method to extract 20% of the full dataset. However, anomaly categories have a lot less records compared with benign data. In particular, some categories only have very small number of records. This may cause data imbalance. In order to resolve the imbalance to support better learning capability, all the records of anomalies were added to produce sub dataset.
2. Training and Testing data
Stratified sampling method was used to divide the sub dataset into 80% for training and 20% for testing.
3. Handling missing value and columns with zeros
Two columns ‘Flow Bytes/S’ and ‘Flow Packets/s’ have missing values in them. These values are replaced by their means in each group, respectively. Columns 'Bwd PSH Flags','Bwd URG Flags'. 'Fwd Avg Bytes/Bulk', 'Fwd Avg Packets/Bulk', 'Fwd Avg Bulk Rate', 'Bwd Avg Bytes/Bulk','Bwd Avg Packets/Bulk' and 'Bwd Avg Bulk Rate' have only 0s in them. They are therefore removed in the preparation step.
4. Data normalization
All features were normalized by MinMaxScaler from scikit package in Python. Training data and testing data were normalized separately.
Model Construction
The machine learning models were developed to not only detect anomaly behaviours, but also classify the categories of the anomaly behaviours.
Shallow Learning Models
Random Forest (RF)
RF is an ensemble method which combines lots of individual decision trees, as illustrated in the Figure 6 below. Each individual tree employs some of the features and spits out a class prediction. The class that receives the most votes becomes RF model’s final prediction. Two RF models were developed using NSL-KDD and CIC-IDS2017 datasets respectively.
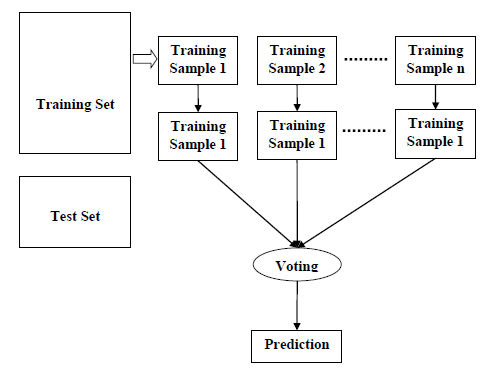
Figure 6 Random Forest algorithm steps
Support Vector Machine (SVM)
SVM works by finding out the separating hyperplane which maximizes the margin between two classes. A SVM model was developed using NSL-KDD to provide comparison data against RF method. A non-linear soft-margin classifier was adopted in this model.

K Nearest Neighbour (KNN)
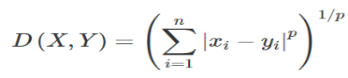
KNN is a non-parametric classification method among which an object is classified by a vote of its K nearest neighbours. It is renowned for its classification abilities in high-dimensional problems. Minkowski Distance calculation as the formular below was adopted in model construction. A KNN model was developed using CIC-IDS2017 dataset.
Deep Learning Models
Multi-Layer Perceptron Neural Network (MLP-NN)
MLP-NN is a class of feedforward Artificial Neural Network (ANN). Our models comprise multiple hidden layers of nonlinearly-activating neurons. Learning occurs in the neurons by changing connection weights after each piece of data is processed, based on the amount of error in the output compared to the expected result. Two MLP-NN models were developed using the NSL-KDD and CIC-IDS2017 datasets respectively.
The diagram Figure 7 illustrates the high-level architecture of a general Artificial Neural Network algorithm.
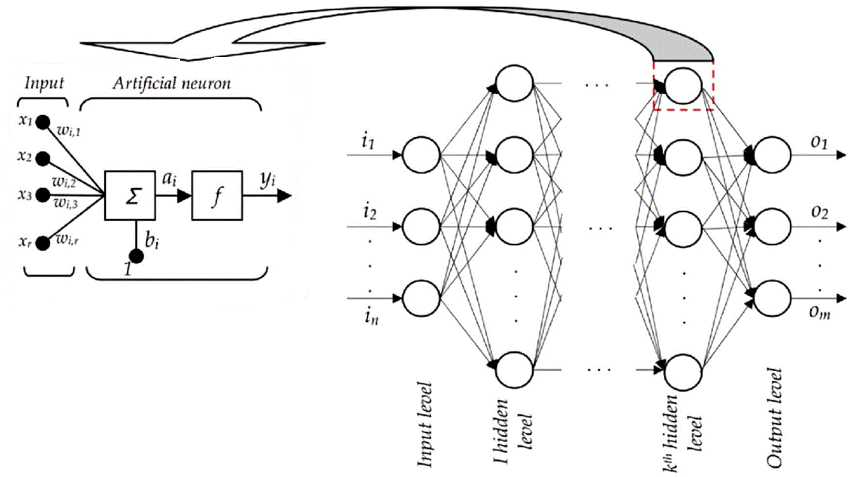
Figure 7 Artificial Neural Network architecture
Convolutional Neural Network Long Short-Term Memory (CNN-LSTM)
The CNN-LSTM model developed in this project is composed of a convolution 1d layer (input), a LSTM layer, a dropout layer and an output layer. It was trained with NSL-KDD dataset to compare with MLP-NN model.
Reinforcement Learning Model
Adversarial Reinforcement Learning (ARL)
An ARL model was developed which includes a classifier agent and an environment agent, both of which are Deep Q Networks (DQN) consisting of MLP-NN models with three hidden layers in the classifier agent and one hidden layer in the environment agent. Each hidden layer has 100 neurons in it. An optimal Q-function was adopted, which obeys the Bellman optimality equation:

The model works by training both agents at the same time, and iteratively rewards the classifier agent once a correct classification is performed. The ARL model was trained and experimented using the CIC-IDS2017 dataset.
ARL Model Training
During the process of model training, the environment agent used records from CIC-IDS2017 dataset to create attacks while the classifier agent was rewarded when it correctly identified the category of an attack.
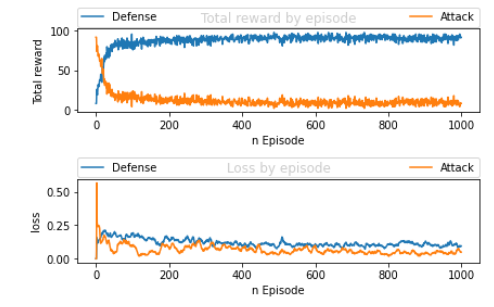
Figure 8 ARL model training - total reward and loss of two agents
Figure 8 shows the classifier agent improving its ability to defend the type of attack each successive episode while the environment agent becomes more unsuccessful making an attack. The classifier and environment agents exhibit expected behaviour of total reward converges to a value. The environment agent used a varied type of attacks for each episode. Figure 9 shows the distribution of the attacks across all the categories in each episode. The distribution shapes varied throughout the process.
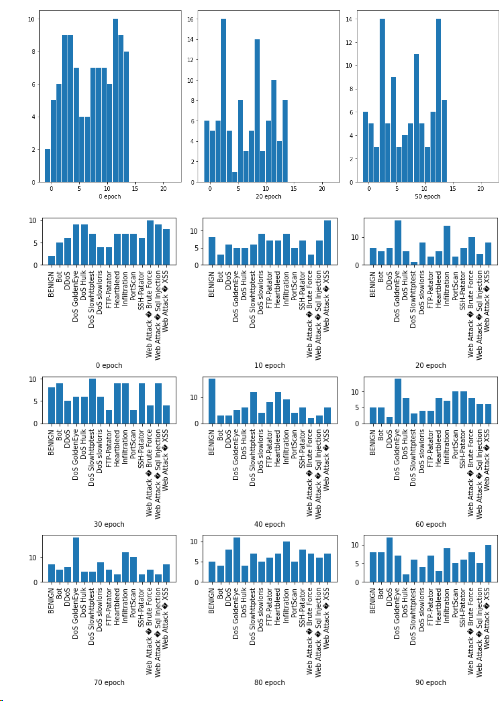
Figure 9 Distribution of attacks at different epoch levels
Experiment Results
The key objective of the model development and experiments is to explore the suitability and potential of Reinforcement Learning method in detecting network emerging attacks.
The models were trained and tested using traditional machine learning experiment approach.
Analysis and Evaluation Metrics
Parameters
True positive (TP): number of harmful applications correctly classified.
True negative (TN): number of benign applications correctly classified.
False positive (FP): number of benign applications misclassified as harmful. It is regarded as the main drawback of classification methods.
False negative (FN): number of harmful applications misclassified as benign.
Performance metrics
| Name | Description |
| Accuracy (ACC) | Percentage of correct predictions (positive and negative). (TP + TN) / (TP + TN + FP + FN) |
| Precision | Precision: percentage of correct positives over the total number of positives identified. TP / (TP + FP) |
| Detection Rate (DR) | The detection rates are evaluated using the Area Under the Curve (AUC) of the receiver operating characteristics (ROC). The detection latency is evaluated by measuring the mean computing time to detect whether a data sample is an intrusion. DR-attack = TP / (TP + FN) |
| Sensitivity | Sensitivity measures the proportion of attack profiles correctly identified. TP / (TP + FN) |
| Specificity | Specificity measures the percent of authentic profiles correctly classified, thus providing insight as to the portion of the original authentic profiles that are used for prediction. |
| F-measures (F1-score) | From precision and recall, this parameter measures the accuracy of the method 2 * {(Precision * Sensitivity) / (Precision + Sensitivity)} |
| False Alarm Rate (FAR) | False alarms are the benign instances incorrectly classified over the total number of benign samples. FP / TN + FP |
| False Negative and Positive | False positives over the total number of positives identified FP / TP + FP False negative over the total number of positives identified FN / FN + TN |
| Miss Rate | Harmful instances incorrectly classified over the total number of harmful samples FN / (TP + FN) |
| Error Rate | Incorrectly classified instances over the total (FP + FN) / (TP + TN + FP +FN) |
This project measures the performance of the developed machine learning models in two scenarios, 1) the classification of each anomaly category, 2) the binary detection of anomalies from benign records. The measurement was scaled between 0 to 1 when 1 was 100%.
Detection Performance when using NSL-KDD Dataset
The four models designed by Random Forest (RF), Support Vector Machine (SVM), Multi-Layer Perceptron Neural Network (MLP-NN), and Convolutional Neural Network Long Short-Term Memory (CNN-LSTM) methods respectively were trained and tested using NSL-KDD dataset.
The key performance metrics were measured against the binary detection and listed in the table below.
| Model | Accuracy | Precision | Specificity | Sensitivity | F-measure |
| RF | 0.79 | 0.97 | 0.97 | 0.68 | 0.80 |
| SVM | 0.79 | 0.93 | 0.93 | 0.69 | 0.79 |
| MLP-NN | 0.79 | 0.92 | 0.92 | 0.69 | 0.79 |
| CNN-LSTM | 0.79 | 0.95 | 0.95 | 0.68 | 0.80 |
Table 3 Binary detection performance - NSL-KDD
The results in this table showed the performance of these four models was very similar to each other, among which RF model showed the best overall performance. There are rooms to improve the performance of these models. For the purpose of providing benchmark comparison, these measures were sufficient to show the effectiveness of these methods.
Detection Results when using CIC-IDS2017 Dataset
The four models designed by Random Forest (RF), K Nearest Neighbour (KNN), Multi-Layer Perceptron Neural Network (MLP-NN), and Adversarial Reinforcement Learning (ARL) methods respectively were trained and experimented using CIC-IDS2017 dataset.
The precision and F-measure of the four models classifying the fifteen anomaly categories were measured. The results are presented in the following table.
| Category | KNN | RF | MLP-NN | ARL | Number of cases in the data | ||||
| Precision | F1-score | Precision | F1-score | Precision | F1-score | Precision | F1-score | ||
| Benign | 0.90 | 0.94 | 0.99 | 0.99 | 0.79 | 0.87 | 0.94 | 0.85 | 90924 |
| Bot | 0.92 | 0.73 | 0.78 | 0.41 | 1.00 | 0.04 | 0.02 | 0.04 | 393 |
| DDoS | 1.00 | 0.99 | 1.00 | 1.00 | 0.99 | 0.91 | 0.91 | 0.59 | 25606 |
| DoS Goldeneye | 0.99 | 0.96 | 1.00 | 0.98 | 0.91 | 0.33 | 0.49 | 0.58 | 2059 |
| Dos Hulk | 0.99 | 0.90 | 1.00 | 1.00 | 0.97 | 0.82 | 0.69 | 0.80 | 46215 |
| Dos SlowHTTPTest | 0.90 | 0.94 | 0.99 | 0.96 | 0.97 | 0.12 | 0.25 | 0.39 | 1100 |
| Dos SlowLoris | 0.99 | 0.94 | 1.00 | 0.98 | 1.00 | 0.56 | 0.21 | 0.29 | 1159 |
| FTP-Patator | 1.00 | 1.00 | 1.00 | 1.00 | 0.00 | 0.00 | 0.66 | 0.79 | 1588 |
| Heartbleed | 1.00 | 0.67 | 1.00 | 0.67 | 0.00 | 0.00 | 0.00 | 0.00 | 2 |
| Infiltration | 0.5 | 0.22 | 1.00 | 0.73 | 0.00 | 0.00 | 0.00 | 0.00 | 7 |
| PortScan | 0.97 | 0.97 | 1.00 | 1.00 | 0.91 | 0.94 | 0.93 | 0.95 | 31786 |
| SSH-Patator | 1.00 | 0.68 | 1.00 | 1.00 | 0.00 | 0.00 | 0.39 | 0.43 | 1180 |
| Web attack Brute force | 0.79 | 0.59 | 0.74 | 0.73 | 0.00 | 0.00 | 0.00 | 0.00 | 301 |
| Web attack SQL injection | 0.00 | 0.00 | 0.00 | 0.00 | 0.00 | 0.00 | 0.00 | 0.00 | 4 |
| Web attack XSS | 0.43 | 0.13 | 0.26 | 0.32 | 0.00 | 0.00 | 0.00 | 0.00 | 130 |
Table 4 Anomaly category classification performance - CIC-IDS2017
From these results, it is obvious that the Shallow Learning RF and KNN models had better performance while the overall performance of all the models was good.
The binary detection secenario grouped the data to ‘benign’ and ‘anomaly’ only, where the ‘anomaly’ group included all the categories not belonging to the ‘benign’ group. Table 5 illustrates the binary detection performance measures of the four models.
It is clear that RF model had the best performance overall. KNN model also showed strong performance which was similar to RF. The performance of both MLP-NN and ARL models under binary scenario was better than classifying each category but less desired compared with RF and KNN models.
| Metrics | KNN | RF | MLP-NN | ARL |
| Accuracy | 0.95 | 1.00 | 0.87 | 0.87 |
| Precision | 0.91 | 0.99 | 0.79 | 0.96 |
| Specificity | 0.90 | 0.99 | 0.79 | 0.94 |
| Sensitivity | 0.99 | 1.00 | 0.97 | 0.84 |
| F-measure | 0.95 | 0.95 | 0.87 | 0.89 |
| Detection Rate | 0.99 | 1.00 | 0.97 | 0.84 |
| False Alarm Rate | 0.10 | 0.01 | 0.21 | 0.06 |
| Miss Rate | 0.01 | 0.00 | 0.03 | 0.16 |
| Error Rate | 0.05 | 0.00 | 0.13 | 0.13 |
| False Positive Rate | 0.09 | 0.01 | 0.21 | 0.04 |
| False Negative Rate | 0.01 | 0.00 | 0.03 | 0.23 |
Table 5 Binary detection performance - CIC-IDS2017
Meanwhile, the feature importance was measured when developing the RF model. The following Figure 10 includes the 20 most important features that RF model considered in its decision-making process. It shows the ‘Packet Length Variance’ and ‘Packet length Std’ were two most important features.
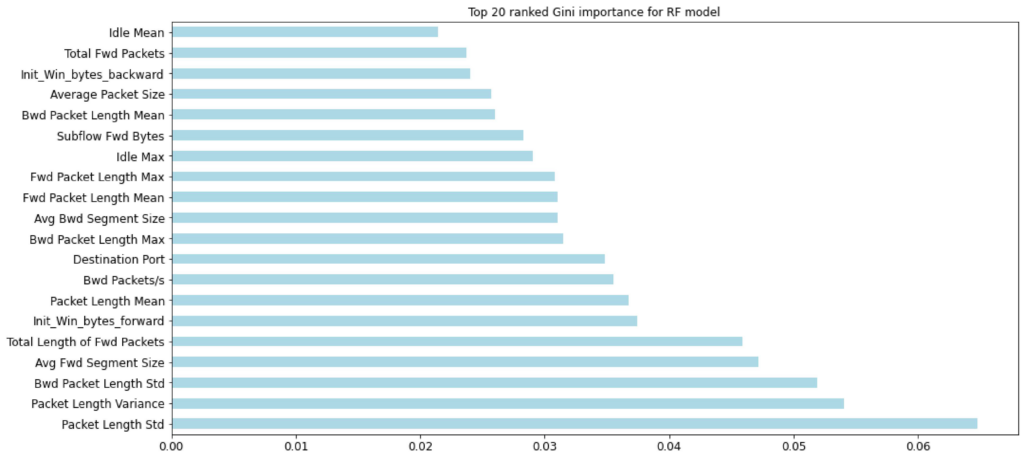
Figure 10 Gini feature importance - RF model
There were two models developed by RF method using two different datasets respectively. The performance of these two models is compared in the Table 6 below.
| Dataset | Accuracy | Precision | Specificity | Sensitivity | F-measure |
| NSL-KDD | 0.79 | 0.97 | 0.97 | 0.68 | 0.80 |
| CIC-IDS2017 | 1.00 | 0.99 | 0.99 | 1.00 | 0.95 |
Table 6 RF model performance against the two datasets
There were two models developed by MLP-NN method using two different datasets respectively. The performance of these two models is compared in the Table 7 below.
| Dataset | Accuracy | Precision | Specificity | Sensitivity | F-measure |
| NSL-KDD | 0.79 | 0.92 | 0.92 | 0.69 | 0.79 |
| CIC-IDS2017 | 0.87 | 0.96 | 0.94 | 0.84 | 0.89 |
Table 7 MLP-NN model performance against the two datasets
Both RF and MLP-NN models showed obvious variations of performance measures between the two datasets. This indicates these machine learning models are sensitive to different data structure.
Phase III Experiment a Novel Evaluation Method on the Trained Models
Evaluation Approach
The purpose of the evaluation process conducted in this project beyond the traditional ML model experiment processes is to explore an approach which simulates the real environment where a ML model is implemented to detect network-attacks in real-time. So that the evaluation results can indicate the effectiveness of a ML model in real-time detection.
In real environments the network traffic data streams across network components. However, processing streaming data in real-time as part of system operation can be expensive at the risks of degrading the system performance. The proposed evaluation method assumes the network traffic data and system logs can be captured in batches using the similar method as how the CICIDS2017 was constructed [19]. The network traffic can be extracted and constructed at a certain interval.
An evaluation pipeline was established in a cloud-based environment which allows a simulator to send continuous batches to pipeline endpoints at a configurable interval. The data flows automatically trigger the data preparation processes and execute the trained models. The evaluation pipeline can be deployed in any real network environments. Figure 11 demonstrates the concept of the evaluation pipeline.
Limitation
Within the scope of this project, the real-time network traffic is not collected or constructed. A public dataset that was produced with relatively comprehensive profile and emerging attacks is to be applied. The continuous batch files were generated by applying random sampling method on the adopted public datasets.
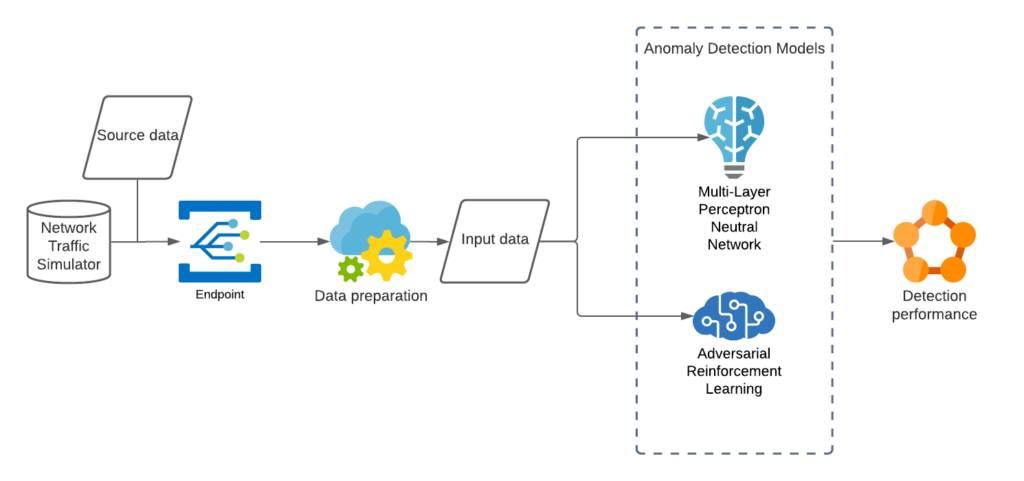
Figure 11 AI anomaly detection model evaluation pipeline
Evaluation Scenario 1
In order to understand how well ML models works in real environments, this evaluation scenario focuses on implementing the trained ML models to detect anomalies in each batch file which has varieties of anomaly density and category distribution.
This evaluation scenario measures the classification and detection performance of the models across continuous small network data batches. The results are compared across the batches to observe the performance consistency and stability.
Evaluation Scenario 2
This evaluation scenario focuses on the comparison of the robustness of the trained ML models when encountering changes or noise in feature space. Ideally, this evaluation could be conducted with real network data noise and uncertainties. However, real network data construction is out of the scope of this project. The evaluation scenario 2 applied one dataset for training and a different dataset for evaluation. Though this approach imposes the risk of causing the ML models ineffective, it may still compare the different robustness in various models.
Evaluation Datasets
Running anomaly detection models over real labelled network traces with a comprehensive and extensive set of intrusions and abnormal behaviour is the most idealistic methodology for testing and evaluation. This itself is a significant challenge. As network behaviours and patterns change and intrusions evolve, it has very much become necessary to move away from static and one-time datasets towards more dynamically generated datasets, which not only reflect the traffic compositions and intrusions of that time, but are also modifiable, extensible, and reproducible. Within the scope of this project, we applied CICIDS2017 dataset, which is close to realistic network data with zero-attacks, to simulate the realistic network data for evaluation.
Other than CICIDS2017 dataset, another dataset CES-CICIDS2018 was produced by the same organisation - Canadian Institute for Cybersecurity (CIC). This dataset used the notion of profiles to generate datasets in a systematic manner, which contains detailed descriptions of intrusions and abstract distribution models for applications, protocols, or lower-level network entities. Both the CICIDS2017 and CSE-CICIDS2018 datasets include seven different attack scenarios: Brute-force, Heartbleed, Botnet, DoS, DDoS, Web attacks, and infiltration of the network from inside. The datasets include the captures network traffic and system logs of each machine, along with 80 features extracted from the captured traffic using CICFlowMeter [19].
At the first glance, these two datasets have very similar feature structure. However, when we analysed in more depth on the constructed data, CES-CICIDS2018 dataset has different feature and anomaly distribution shape compared with the CICIDS2017 dataset. The detailed analysis of the data extraction and construction processes of these two datasets are not included in the scope of this project.
This project used CICIDS2017 dataset to conduct the evaluation scenario 1, to evaluate the consistency and stability of the trained ML models in cloud-based evaluation pipelines processing the randomly sampled batch flows. CES-CICIDS2018 dataset was adopted to measure the robustness of the four ML models trained by CICIDS2017 dataset to explore the capabilities of these models when facing feature and anomaly changes.
Evaluation Process
The steps of experimenting the evaluation method and pipelines were as the following:
- Applied random sampling method on CICIDS2017 and CSE-CICIDS2018 data which is outside of the model training data to generate the network data batch files. Each batch file contains 20,000 records.
- Built a simulator to send the batch network data files at a configurable interval to the evaluation pipeline endpoints.
- Implemented an evaluation pipeline on the TeleMARS cloud-based platform to automatically
- receive the incoming batch flows;
- prepare the incoming batch files to get ready to feed the models; and
- execute the trained machine learning models on the prepared data to detect anomalies in each batch.
Evaluation Results
Performance Consistency and Stability
The tables below show the performance measures of classifying anomaly categories over randomly picked three batch files, as well as the binary detection performance measures of each model.
Bath file 1
| Category | KNN | RF | MLP-NN | ARL | Number of cases in the data | ||||
| Precision | F1-score | Precision | F1-score | Precision | F1-score | Precision | F1-score | ||
| Benign | 1.00 | 0.99 | 1.00 | 1.00 | 1.00 | 0.99 | 0.99 | 0.92 | 8978 |
| Bot | 0.88 | 0.92 | 0.93 | 0.91 | 0.84 | 0.76 | 0.11 | 0.19 | 46 |
| DDoS | 1.00 | 1.00 | 1.00 | 1.00 | 1.00 | 1.00 | 0.98 | 0.99 | 2549 |
| DoS Goldeneye | 1.00 | 1.00 | 0.99 | 1.00 | 1.00 | 1.00 | 0.78 | 0.87 | 193 |
| Dos Hulk | 1.00 | 1.00 | 1.00 | 1.00 | 0.99 | 1.00 | 0.95 | 0.96 | 4560 |
| Dos SlowHTTPTest | 0.98 | 0.99 | 1.00 | 1.00 | 0.98 | 0.98 | 0.68 | 0.80 | 127 |
| DOS SlowLoris | 0.99 | 1.00 | 1.00 | 1.00 | 0.97 | 0.98 | 0.51 | 0.67 | 116 |
| PortScan | 0.96 | 0.98 | 1.00 | 1.00 | 0.98 | 0.99 | 0.94 | 0.96 | 3141 |
| Brute force | 0.68 | 0.75 | 0.82 | 0.78 | 0.78 | 0.88 | 0.01 | 0.02 | 36 |
| Web attack XSS | 0.30 | 0.30 | 0.26 | 0.29 | 1.00 | 0.18 | 0.10 | 0.18 | 10 |
Table 8 Classification of each category in batch file 1
| Metrics | KNN | RF | MLP-NN | ARL |
| Accuracy | 0.99 | 1.00 | 0.99 | 0.93 |
| Precision | 1.00 | 1.00 | 1.00 | 0.99 |
| Specificity | 1.00 | 1.00 | 1.00 | 0.90 |
| Sensitivity | 0.99 | 1.00 | 0.99 | 0.90 |
| F-measure | 0.99 | 1.00 | 0.99 | 0.94 |
| Detection Rate | 0.99 | 1.00 | 0.99 | 0.90 |
| False Alarm Rate | 0.00 | 0.00 | 0.00 | 0.01 |
| Miss Rate | 0.01 | 0.00 | 0.01 | 0.01 |
| Error Rate | 0.01 | 0.00 | 0.01 | 0.07 |
| False Positive Rate | 0.00 | 0.00 | 0.00 | 0.01 |
| False Negative Rate | 0.02 | 0.00 | 0.01 | 0.14 |
Table 9 Binary performance measures for batch file 1
Batch file 2
| Category | KNN | RF | MLP-NN | ARL | Number of cases | ||||
| Precision | F1-score | Precision | F1-score | Precision | F1-score | Precision | F1-score | ||
| Benign | 1.00 | 0.99 | 1.00 | 1.00 | 1.00 | 0.99 | 0.99 | 0.92 | 9007 |
| Bot | 0.97 | 0.93 | 1.00 | 0.94 | 1.00 | 0.85 | 0.08 | 0.15 | 38 |
| DDoS | 1.00 | 1.00 | 1.00 | 1.00 | 1.00 | 1.00 | 0.98 | 0.99 | 2500 |
| DoS Goldeneye | 0.99 | 0.99 | 1.00 | 1.00 | 0.99 | 0.99 | 0.82 | 0.89 | 216 |
| Dos Hulk | 1.00 | 1.00 | 1.00 | 1.00 | 1.00 | 1.00 | 0.96 | 0.96 | 4530 |
| Dos SlowHTTPTest | 1.00 | 1.00 | 1.00 | 1.00 | 0.99 | 0.99 | 0.74 | 0.84 | 124 |
| DOS SlowLoris | 0.99 | 1.00 | 1.00 | 1.00 | 0.98 | 0.98 | 0.57 | 0.72 | 127 |
| Infiltration | 0.0 | 0.0 | 0.0 | 0.0 | 0.0 | 0.0 | 0.0 | 0.0 | 1 |
| PortScan | 0.97 | 0.98 | 1.00 | 1.00 | 0.98 | 0.99 | 0.94 | 0.96 | 3136 |
| Brute force | 0.57 | 0.67 | 0.77 | 0.78 | 0.63 | 0.77 | 0.07 | 0.1 | 34 |
| SQL injection | 0.0 | 0.0 | 0.0 | 0.0 | 0.0 | 0.0 | 0.0 | 0.0 | 1 |
| Web attack XSS | 0.21 | 0.19 | 0.53 | 0.50 | 0.0 | 0.0 | 0.16 | 0.28 | 17 |
Table 10 Classification of each category in batch file 2
| Metrics | KNN | RF | MLP-NN | ARL |
| Accuracy | 0.99 | 1.00 | 1.00 | 0.93 |
| Precision | 1.00 | 1.00 | 1.00 | 0.99 |
| Specificity | 1.00 | 1.00 | 1.00 | 0.99 |
| Sensitivity | 0.99 | 1.00 | 0.99 | 0.90 |
| F-measure | 0.99 | 1.00 | 1.00 | 0.94 |
| Detection Rate | 0.99 | 1.00 | 0.99 | 0.90 |
| False Alarm Rate | 0.00 | 0.00 | 0.00 | 0.01 |
| Miss Rate | 0.01 | 0.00 | 0.01 | 0.10 |
| Error Rate | 0.01 | 0.00 | 0.00 | 0.07 |
| False Positive Rate | 0.00 | 0.00 | 0.00 | 0.01 |
| False Negative Rate | 0.01 | 0.00 | 0.01 | 0.13 |
Table 11 Binary performance measures for batch file 2
Batch file 3
| Category | KNN | RF | MLP-NN | ARL | Number of cases | ||||
| Precision | F1-score | Precision | F1-score | Precision | F1-score | Precision | F1-score | ||
| Benign | 1.00 | 0.99 | 1.00 | 1.00 | 1.00 | 0.99 | 0.99 | 0.92 | 8929 |
| Bot | 0.86 | 0.91 | 0.91 | 0.93 | 0.85 | 0.77 | 0.08 | 0.15 | 32 |
| DDoS | 1.00 | 1.00 | 1.00 | 1.00 | 1.00 | 1.00 | 0.98 | 0.99 | 2556 |
| DoS Goldeneye | 0.98 | 0.99 | 0.99 | 0.99 | 1.00 | 0.99 | 0.76 | 0.86 | 218 |
| Dos Hulk | 1.00 | 1.00 | 1.00 | 1.00 | 0.99 | 1.00 | 0.96 | 0.96 | 4589 |
| Dos SlowHTTPTest | 0.99 | 1.00 | 0.98 | 0.99 | 1.00 | 1.00 | 0.73 | 0.83 | 106 |
| DOS SlowLoris | 0.99 | 0.97 | 0.99 | 0.98 | 0.97 | 0.97 | 0.55 | 0.69 | 117 |
| PortScan | 0.96 | 0.98 | 1.00 | 1.00 | 0.98 | 0.99 | 0.93 | 0.96 | 3148 |
| Brute force | 0.75 | 0.81 | 0.78 | 0.72 | 0.78 | 0.87 | 0.04 | 0.06 | 37 |
| Web attack XSS | 0.27 | 0.30 | 0.14 | 0.17 | 0.0 | 0.0 | 0.10 | 0.18 | 9 |
Table 12 Classification of each category in batch file 3
| Metrics | KNN | RF | MLP-NN | ARL |
| Accuracy | 0.99 | 1.00 | 0.99 | 0.93 |
| Precision | 1.00 | 1.00 | 1.00 | 0.99 |
| Specificity | 1.00 | 1.00 | 1.00 | 0.99 |
| Sensitivity | 0.99 | 1.00 | 0.99 | 0.90 |
| F-measure | 0.99 | 1.00 | 0.99 | 0.94 |
| Detection Rate | 0.99 | 1.00 | 0.99 | 0.90 |
| False Alarm Rate | 0.00 | 0.00 | 0.00 | 0.01 |
| Miss Rate | 0.01 | 0.00 | 0.01 | 0.10 |
| Error Rate | 0.01 | 0.00 | 0.01 | 0.07 |
| False Positive Rate | 0.00 | 0.00 | 0.00 | 0.01 |
| False Negative Rate | 0.02 | 0.00 | 0.01 | 0.14 |
Table 13 Binary performance measures for batch file 3
Processing time
The table below records the pipeline data preparation time and model processing time of running a model on a single batch file. The results are compared among the four models over four randomly picked batches.
| Model | Batch file no. | Pipeline data preparation duration (mm:ss) | Model processing duration (mm:ss) |
| RF | 1 | 00:26 | 00:01 |
| KNN | 1 | 00:17 | 08:55 |
| MPL-NN | 1 | 00:19 | 00:02 |
| ARL | 1 | 00:17 | 00:02 |
| RF | 2 | 00:18 | 00:01 |
| KNN | 2 | 00:32 | 08:33 |
| MPL-NN | 2 | 00:42 | 00:01 |
| ARL | 2 | 00:16 | 00:02 |
| RF | 3 | 00:20 | 00:01 |
| KNN | 3 | 00:17 | 08:33 |
| MPL-NN | 3 | 00:22 | 00:01 |
| ARL | 3 | 00:27 | 00:02 |
| RF | 4 | 00:27 | 00:01 |
| KNN | 4 | 00:18 | 08:18 |
| MPL-NN | 4 | 00:30 | 00:01 |
| ARL | 4 | 00:43 | 00:01 |
Table 14 Evaluation processing time
Robustness of the ML Models
The table below compares the binary detection performance across the four models when sending the batch files generated from CES-CICIDS2018 data through the evaluation pipeline.
| Metrics | KNN | RF | MLP-NN | ARL |
| Accuracy | 0.53 | 0.35 | 0.64 | 0.60 |
| Precision | 0.38 | 0.14 | 0.53 | 0.57 |
| Specificity | 0.35 | 0.28 | 0.43 | 0.36 |
| Sensitivity | 0.94 | 0.84 | 0.98 | 0.83 |
| F-measure | 0.54 | 0.24 | 0.68 | 0.67 |
| Detection Rate | 0.94 | 0.84 | 0.98 | 0.83 |
| False Alarm Rate | 0.65 | 0.72 | 0.57 | 0.64 |
| Miss Rate | 0.06 | 0.16 | 0.02 | 0.17 |
| Error Rate | 0.47 | 0.65 | 0.36 | 0.40 |
| False Positive Rate | 0.63 | 0.86 | 0.47 | 0.43 |
| False Negative Rate | 0.07 | 0.07 | 0.03 | 0.32 |
Table 15 Binary detection performance measures for batch file from CES-CIC-IDS2018 data
Findings
Observation Summary
The performance metrics of RF and MLP-NN models against the two datasets were compared in "Table 6 RF model performance against the two datasets" and "Table 7 MLP-NN model performance against the two datasets". There are obvious variations of performance measures between the two datasets while the overall performance of anomaly detection is good.
The binary detection performance results recorded in "Table 3 Binary detection performance - NSL-KDD" and "Table 5 Binary detection performance - CIC-IDS2017" showed that the Shallow Learning models such as RF and KNN performed stronger than the MLP-NN and ARL models. RF model had the best overall performance in all the experiments.
The results of the anomaly category classification performance in "Table 4 Anomaly category classification performance" showed the Shallow Learning RF and KNN models were more effective in classifying the anomaly categories with small number of records.
The evaluation results recorded in the tables from Table 8 to Table 13 were consistent cross three randomly selected batch files. There were insignificant fluctuations in the results of classification of a couple of categories which have small number of records. This is expected behavior of ML models. The results of binary detection performance were highly consistent.
Table 15 shows the models trained with CICIDS2017 data performed poorly in detecting the anomalies in CES-CIC-IDS2018 data. MPL-NN model had better overall performance.
Findings
- The Shallow Learning RF model showed the best overall performance in detecting emerging attacks using traditional machine learning experiment approach, in particular stronger in classifying the anomaly categories that have only small number of records. KNN model shows similar strong capabilities.
- The Reinforcement Learning ARL model had good performance but did not show any advantage over other models. However, there are rooms for Deep Learning and Reinforcement Learning models to improve their prediction accuracy and detection sensitivity. Neural Network architecture could be further adapted by modifying the layers, the number of neurons or hyperparameters in each layer, and the dependencies between the neurons and the layers. The architecture reconstruction has chance to lead to the improvements of anomaly detection performance.
- The differences of performance between the model experiments using NSL-KDD dataset and CIC-IDS2017 dataset respectively showed that ML models are sensitive to data structure.
- The evaluation results proved the detection performance of the ML models stay consistent and stable when data volume, anomaly density and category distribution change.
- The evaluation method and the pipelines can be applied to support future real-time detection research.
- The RF, MPL-NN and ARL models were highly efficient in execution time and resource balance when processing small batch files. However, KNN consumed a lot larger resource and took significantly longer processing time. This indicates the implementation of KNN models in real network environment may be expensive.
- When the testing data feature space is different from the training dataset, ML models do not perform well in general. So that the ML methods are not effective in this kind of situations.
- The MPL-NN model showed relatively better robustness in overall detection performance. This indicates that Neural Network method which is regression based is more resilient in dealing with changes in feature space. This method could be adopted to add robustness into anomaly detection models in real network environment.
Project Evaluation
To what extend the project achieved its objectives? What contribution to development did the project make? Is there evidence of positive impact?
Multiple Shallow Learning classification models, Deep Learning Neural Network models, and a novel Reinforcement Learning model were designed, developed and experimented against a benchmark dataset and a recent dataset including emerging attacks. The emerging attack detection performance of Reinforcement Learning model was measured against multiple metrics and compared against three other models under the same settings in a same experiment environment.
The results proved that machine learning (ML) methods are effective in anomaly detection on emerging attacks. At the same time, the limitations of traditional ML model experimentation processes were identified. The project information can be referenced by any future research which uses machine learning methods to resolve cyber-attack problems. The results provided evidences to research community to support the recommendations of what the next stage research opportunities are.
The evaluation outcomes proved the proposed evaluation approach and platform were effective with consistent and stable detection performance across all the batches. This evaluation platform can support future research activities in real-time detection.
The TeleMARS operation and technical frameworks were adopted to manage and deliver the project. Teamwork structure, processes and culture was improved, which supported the smooth delivery of the project and the team capability enhancement.
An R&D collaboration framework was implemented, which enabled structured collaborations among subject matter experts, data engineers and data scientists from diverse backgrounds to work on the various aspects of each project phase. The completion and the outcomes of the experiments and evaluations proved the platform is capable of supporting the on-going collaborations across a wider research and IT communities beyond the scope of this project. It enables on-going research efforts towards the development of real-time detection NIDS applications that can be deployed in real network environments.
To what extent the project delivered benefits/outcomes that support gender equality, diversity and inclusion?
TeleMARS engaged a senior female data scientist, Dr. Jing Yang, to work on the data preparation and ML model development. This provided an opportunity for her to expand her research experience to the subject domain of cybersecurity. Through this project, Dr. Jing Yang gained new skills in achieving research outcomes more efficiently by collaborating closely with other professionals such as data engineers and software engineers. This engagement worked as part of the team building strategy for TeleMARS to promote the culture of gender equality while developing a strong data science team.
The project lead – Chen Lin, exercised and strengthened her leadership skills when designing, planning and managing the delivery of the project. The positive project outcomes promoted the contributions of women professionals’ leadership in R&D innovations.
This project implemented a collaboration framework to encourage the culture of inclusion.
To what extent has the project lived to its potential for growth/further development?
Multiple ML models were developed and experimented including a novel Reinforcement Learning model. Benchmark dataset and a recent dataset including emerging attacks were adopted for training and experiments. The anomaly detection performance of the models was measured against 12 performance metrics. The results and findings provided solid reference to research community for future studies.
The evaluation outcomes demonstrated strong effectiveness of the proposed evaluation method and technical framework which can support future real-time detection research.
The collaboration framework will support a larger group of researchers and professionals to work on larger scope projects effectively. This enables on-going development beyond the scope of this project.
To what extent do the proposed activities support the development of local technical capacity in a gender equality and inclusion framework?
One of the key achievements of this project is the implementation of a collaboration framework. This framework promotes and enables R&D work to be jointly delivered by the researchers and professionals from different domains. This increases opportunities for local talents from various background or gender groups to participate and grow in the research of cybersecurity. Through the collaborative research activities, the local talents gain opportunities of learning new skills and knowledge across multiple subject domains and disciplines. The increased diversity of skilled professionals broadens local technical capability bandwidth and increase the dimensions of technical strengths.
What were the most important findings and outputs of the project? What will be done with them?
The key findings are summarised as below.
- The Shallow Learning Random Forest (RF) and K-Nearest Neighbour (KNN) models demonstrated stronger performance of detecting emerging attacks.
- The Reinforcement Learning ARL model did not show any advantage over other experimented models.
- The proposed evaluation method and platform of simulating real network scenario to evaluate the trained models is effective with consistent and stable detection performance.
- Compared with other models, the KNN model consumed larger amount of resource and required significant longer processing time, while other three models each processed a batch file within 1-2 seconds.
- The machine learning models do not perform well when the test data feature space is different from the training data. They are sensitive to the changes.
- The Neural Network MPL-NN model which is regression based showed relatively better robustness under such changes.
The findings indicate that the critical challenges of applying machine learning (ML) model in detecting cyber-attacks are:
- Constructing the real network data into the right shape and structure that ML models are trained from; and
- Improving the robustness of the ML models when facing any feature space changes.
According to the findings, a combination of Shallow Learning RF method and Neural Network method may produce more effective anomaly detection model in real network environment.
The next step opportunities are:
- Developing an approach and mechanism to collect and construct real network traffic data into suitable structure for ML model implementation;
- Developing an approach to utilise honeypot techniques and infrastructure to produce data for real-time detection research and development; and
- Improving ML model architecture by combining the RF and NN method.
| Indicators | Baseline | Project activities related to indicator | Outputs and outcomes | Status |
|---|---|---|---|---|
| How do you measure project progress, linked to the your objectives and the information reported on the Implementation and Dissemination sections of this report. | Refers to the initial situation when the projects haven’t started yet, and the results and effects are not visible over the beneficiary population. | Refer to how the project has been advancing in achieving the indicator at the moment the report is presented. Please include dates. | We understand change is part of implementing a project. It is very important to document the decision making process behind changes that affect project implementation in relation with the proposal that was originally approved. | Indicate the dates when the activity was started. Is the activity ongoing or has been completed? If it has been completed add the completion dates. |
| S- Specific The performance measures of the selected shallow learning and deep learning models in detecting emerging attacks are stable and reliable, which show strong performance of these models. | The existing learning models did not perform well in detecting emerging attacks. | Literature review was performed to select suitable datasets and the types of ML models. Data analysis was conducted to inform the data preparation processes and the development of ML models. | The performance measures of the models experimented with emerging attacks were detailed in the sub-section “Experiment Results” of the Phase II of the Project Implementation section. The Findings section outlines the outcomes of the result analysis. | The timeframe for Phase I was between 1 October 2020 to 15 January 2021. |
| A-Achievable The performance measures of a reinforcement learning model in detecting emerging attacks are stable and reliable. | Few studies have been carried out to measure the performance of Reinforcement learning model in detecting emerging attacks. | The selected datasets were processed. Models were trained and experimented with the selected datasets including emerging attacks. | The performance measures of the Reinforcement Learning ARL model experimented with emerging attacks were detailed in the sub-section “Experiment Results” of the Phase II of the Project Implementation section. The Findings section outlines the outcomes | The timeframe for Phase II delivery was between 1 February 2021 to 8 May 2021. |
| R-Relevant The successful implementation of the proposed evaluation method that achieves strong consistency and stability. | The previous studies used traditional machine learning training and experiment approach, which did not reflect the real network environment. | An evaluation method and pipeline were designed and experimented to simulate real detection environment and introduce changes in feature space and anomalies. | The evaluation results were detailed in the sub-section “Evaluation Results” of the Phase III of the Project Implementation section. The Findings section detailed the analysis and comparisons of the evaluation results. | The timeframe for Phase III was between 1 April 2021 to 10 June 2021. |
| R - The successful implementation of a collaboration framework that supports the joint efforts across the team with diverse expertise. | There was no such a collaboration framework which supports the collaboration among researchers, engineers and subject matter experts from various domain background and disciplines. | A collaboration framework was implemented by supporting the collaborative research activities and team building throughout the project lifecycle. | The collaboration framework supported the joint effort from various experts to deliver the project smoothly. It is capable of supporting the collaborations among a larger group of researchers and professionals for future research. |
Gender Equality and Inclusion
Chen Lin, a senior female IT professional, worked as a project lead responsible for the management and delivery of this project. She conducted project planning, project management, team management, research methods design, analysis, review and reporting throughout the project lifecycle. This practice promoted the women professionals’ leadership in R&D innovation. This project engaged a senior female data scientist, Dr. Jing Yang. She worked on the data analysis, preparation and model development. She provided mentoring and advices to the team.
We will share the experience of female researchers and women's leadership in this project with community to inspire young women to participate in the research of cybersecurity. The activities that promote gender equality include attending conferences, workshops and potential collaborations with education providers. The goals of these activities are to inspire female students or young women to equip themselves with the required knowledge and skills and to pursue a career in cybersecurity domain.
As an outcome of this project the collaboration framework will continue providing opportunities to a wide diversity of participants, supporting gender equality and inclusion in broader community.
Project Communication Strategy
The users and beneficiaries of the findings are the researchers and the subject matter experts such as networking engineer, who have interest and/or expertise in cybersecurity domain.
Attending conferences or workshops in the relevant subjects is the main communication strategy and approach. Minimum fund of $3,000 dollars has been allocated to communication activities. We have submitted paper to APNIC52 conference which is in progress of finalising the presentation contents.
We also plan to apply for 2021 Women in Technology Award and the 2021 Australian Women in Security Award, as well as attending the events. We will share the experience of this project to other women technologists while attending the events.
Meanwhile the technical report will be published on the company website and other company official media platform such as LinkedIn.
We will also share the project experience and outcomes with the universities or research groups that we collaborate with. The arrangement is in progress. The information and knowledge sharing will be conducted through online meeting application at this stage, which may help the interested researchers to decide their next research topic and the methods.
Recommendations and Use of Findings
The organisations who might benefit from the findings, lessons and recommendations include universities, research institutions, network operators, internet or cloud service providers, the organisations or businesses operating in cybersecurity domain. The findings of this project can be used by these organisations to determine their research plan, design research projects, assess cybersecurity solutions, or determine their technology transformation strategy.
Lessons Learnt
- During the process of the project implementation, we have learnt that the strong collaboration between the subject matter experts and data scientists is critical to develop effective and practical AI-based solutions. In the domain of cybersecurity, it is important that cybersecurity experts, network engineers and data scientists work closely together.
- It is worth spending more time on data analysis at all levels including physical layer, raw digital data, processed data, and data in constructed feature space to make sure the structure and characters of data is fully understood. This is critical for ML model development.
- It is also important to control the quality of each step of data processing which impacts the quality of the models.
Next step research problems
This research has proved that the Shallow Learning classification methods are highly effective in anomaly detection using the traditional machine learning experiment approach. The insignificant variations among the performance measures do not indicate the anomaly detection effectiveness in real network environment.
Further performance improvement using traditional machine learning experiment approach is not the focus of future research effort. Instead, the real-time detection should be studied on multiple aspects. The real-time detection related problems include the following:
- training data construction for a specific network environment;
- improvement of the robustness of anomaly detection model;
- dynamic evaluation mechanism;
- dynamic model training, improvement and deployment;
- lightweight model architecture; and
- operation performance management.
Relations between machine learning methods and network operation
The experiment and evaluation results have shown that the ML models are data sensitive. We believe that the effectiveness of ML models is restricted to the specific network environments where the training data was generated. This indicates that trying to train a perfect model to detect any kind of anomalies in any network environments is not an efficient approach.
The more effective approach would be to develop ML anomaly detection models for specific network environments which have consistent architecture design, development and management. The training data is generated by collecting and constructing network data to represent comprehensive profile of the network behaviours in the specific environment. When the training data and the real-time network data has same or similar feature space structure, the ML-based anomaly detection models are expected to be highly effective.
Challenges
However, there are a number of challenges in this process.
- Firstly, the training data construction requires significant effort from subject matter experts such as cybersecurity engineers and network engineers to work on detailed data analysis to capture and identify comprehensive network behaviours. Then the subject matter experts need to work closely with data scientists to work out the best way to structure the raw data. Data analysts may also join to construct the raw data into a feature structure which does not loss any truth of the network events and behaviours, at the same time is suitable for ML model development and execution.
- Extracting and constructing raw network data into the defined structure in real-time may increase risks in operation performance.
- The constructed real-time network data will still contain some noise. This requires the ML anomaly detection models to be more robust to remain effective in real environments.
- The real network behaviours and events are evolving. The ML models are to be evaluated from time to time.
- The network topology and architecture may change overtime. This may introduce significant changes in network data profile.
- The cyber-attacks are ever evolving. A mechanism that promptly identifies any emerging attacks is to be part of the detection strategy to ensure the ML models are up-to-date.
Based on what we have learnt through this project, TeleMARS will establish collaboration with research partners to continue the research in real-time anomaly detection to develop solutions that is practical in real network environment.
The recommendation to ISIF Asia secretariat is that we would appreciate future communication opportunities with other previous or current grantees to share experience and expertise. This may lead to collaboration opportunities for larger scope research activities.
Bibliography
- Survey of intrusion detection systems: techniques, datasets and challenges; Ansam Khraisat*, Iqbal Gondal, Peter Vamplew and Joarder Kamruzzaman; Khraisat et al. Cybersecurity (2019) 2:20; https://doi.org/10.1186/s42400-019-0038-7
- A holistic review of Network Anomaly Detection Systems: A comprehensive survey; Nour Moustafa, Jiankun Hua, Jill Slayb
- A study on Anomaly Detection GAN-based methods on image data; Emanuel H. Silva1, Johannes V. Lochter
- Deep learning for cyber security intrusion detection: Approaches, datasets, and comparative study; Mohamed Amine Ferrag a , ∗, Leandros Maglaras b , Sotiris Moschoyiannis c , Helge Janicke b; Department of Computer Science, Guelma University, Guelma 240 0 0, Algeria b School of Computer Science and Informatics, De Montfort University, Leicester U.K. c Department of Computer Science, University of Surrey, U.K.
- A detailed analysis of the KDD CUP 99 dataset, http://refhub.elsevier.com/S2214-2126(19)30504-6/sbref0070
- Fraley, James B., and James Cannady. "The promise of machine learning in cybersecurity." SoutheastCon, 2017. IEEE, 2017.
- I. Sharafaldin, A. H. Lashkari, and A. A. Ghorbani, "Toward generating a new intrusion detection dataset and intrusion traffic characterization," in ICISSP, 2018, pp. 108–116
- Chika Yinka-Banjo, Ogban-Asuquo Ugot, “A review of generative adversarial networks and its application in cybersecurity” Artificial Intelligence Review (2020) 53:1721–1736
- Runa Bhaumik, Bamshad Mobasher and Robin Burke1, “A Clustering Approach to Unsupervised Attack Detection in Collaborative Recommender Systems”
- Minghui Gao, Li Ma, Heng Liu, Zhijun Zhang, Zhiyan Ning and Jian Xu, “Malicious Network Traffic Detection Based on Deep Neural Networks and Association Analysis” Sensors 2020, 20, 1452
- Kiran, B. R., Thomas, D. M., and Parakkal, R. (2018). An overview of deep learning based methods for pervised and semi-supervised anomaly detection in videos. arXiv e-prints, page arXiv:1801.03149.
- Kwon, D., Kim, H., Kim, J., C. Suh, S., Kim, I., and Kim, K. (2017). A survey of deep learning-based network anomaly detection. Cluster Computing.
- Perera, P., Nallapati, R., and Xiang, B. (2019). OCGAN: One-class Novelty Detection
- Using GANs with Constrained Latent Representations. arXiv e-prints, page arXiv:1903.08550.
- Phuc Ngo, C., Aristo Winarto, A., Kou Khor Li, C., Park, S., Akram, F., and Lee, H. K. (2019). Fence GAN: Towards Better Anomaly Detection. arXiv e-prints, page arXiv:1904.01209.
- Abusitta, A.; Bellaiche, M.; Dagenais, M.; Halabi, T. A deep learning approach for proactive multi-cloud cooperative intrusion detection system. Future Gener. Comput. Syst. 2019, 98, 308–318.
- Podgorelec, B.; Turkanovic, M.; Karakatic, S. A Machine Learning-Based Method for Automated Blockchain Transaction Signing Including Personalized Anomaly Detection. Sensors 2020, 20, 147.
- Aechan Kim, Mohyun Park, AND Dong Hoon LEE, AI-IDS: Application of Deep Learning to Real-Time Web Intrusion Detection. Special Selection on Scalable Deep Learning for Big Data, IEEE Access VOLUME 8, 2020
- Canadian Institute for Cybersecurity, Datasets https://www.unb.ca/cic/datasets/
- Iman Sharafaldin, Arash Habibi Lashkari, and Ali A. Ghorbani, “Toward Generating a New Intrusion Detection Dataset and Intrusion Traffic Characterization”, 4th International Conference on Information Systems Security and Privacy (ICISSP), Portugal, January 2018
This work is licensed under a Creative Commons Attribution-ShareAlike 4.0 International License 

